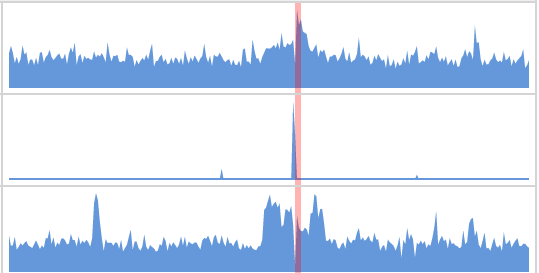
We've talked a lot about the high-resolution data we capture, but if you haven't experienced it yourself, it might be a little abstract. Here, look at the difference between 1-second and 1-minute data.

Are your monitoring systems glossing over important detail with low-frequency data?
All of our metrics are in 1-second granularity. That's 60x more data points per minute than most monitoring tools. It's 120x more data points per second than MongoDB Monitoring Service's premium paid tier. It's 500x more data points per minute than MySQL Enterprise Monitor at its default settings.
It's enough detail to see 1-second server stalls you will
never find otherwise. This gives you the ability to proactively find and stop problems that will become much more serious over time.

And this data is not only real time but historical, so if something happened in the past, you'll be able to rewind the clock easily and investigate.
We'd like to have even higher resolution, but we'll settle for 1-second for the time being. How about you?
 Are your monitoring systems glossing over important detail with low-frequency data?
All of our metrics are in 1-second granularity. That's 60x more data points per minute than most monitoring tools. It's 120x more data points per second than MongoDB Monitoring Service's premium paid tier. It's 500x more data points per minute than MySQL Enterprise Monitor at its default settings.
It's enough detail to see 1-second server stalls you will never find otherwise. This gives you the ability to proactively find and stop problems that will become much more serious over time.
 And this data is not only real time but historical, so if something happened in the past, you'll be able to rewind the clock easily and investigate.
We'd like to have even higher resolution, but we'll settle for 1-second for the time being. How about you?


