Log files are an important source of information about the state of an application and how it’s functioning. Therefore, log management and analysis are critical to application performance monitoring.
Operations teams can analyze logs to gain insights into user-impacting application behavior. For example, repeated application failure messages and a high bounce rate are common indicators of application issues that could result in dissatisfied customers. To identify issues, developers can view and analyze system logs to understand how the application functions and can dig into any errors they find. In doing so, for the example situation with high bounce rates, they could surface a slow query or a failed database connection that may be the cause.
You don’t need to wait for errors to use logs. You can use logs to identify potential or growing performance problems and catch issues before a user experiences lag or poor site behavior.
Despite their benefits—and even when rigorously collected—logs tend to be overlooked or unused. Some reasons for this include:
- Logs aren’t visual in nature, unlike dashboards with graphs of metrics
- Logs spread over many sources, requiring significant time and effort to collate and correlate
- Logs are often too verbose, making it near impossible to find the right information
Most engineers wish they had a better way to make sense of all the information provided in logs.
In this article, we’ll consider a better way. With WordPress logs as our use case, we’ll walk through how to collect and aggregate logs with SolarWinds® Papertrail™ for easy search and smarter analysis.
Introducing SolarWinds Papertrail
Papertrail is a simple yet powerful log management solution from SolarWinds. With Papertrail, you can capture logs from a wide variety of sources in real time, run Unix-like “tail” commands on multiple logs, filter, search, analyze events, and create simple trend graphs and alerts.
WordPress and its log files
WordPress is the most popular content management system (CMS) in the world today. With 455 million sites currently using WordPress as of 2022, and hundreds coming online every day, it boasts a large, active developer community, and a rich ecosystem of tools, technologies, and plugins.
WordPress site administrators need access to logs for total visibility into the health of their sites. With these logs, site reliability engineers can identify user behavior, slow performance, unhandled errors, or possible cyberattacks.
However, there’s no single log for WordPress. The application has its own runtime and uses a web server and a database server in the backend. If you’re using your infrastructure and network to host WordPress, then each of these moving parts has its own logs as well. WordPress itself has its activity log (if configured).
To make the most use of these logs, the first thing to do is get them into one place. From there, you can search, filter, analyze, correlate, visualize, and alert on logged events. Although this is where an Application Performance Management (APM) solution can help, an APM can be overkill if you’re looking for a simple log management and troubleshooting solution. In such cases, Papertrail is an ideal solution.
Setting up Papertrail with WordPress
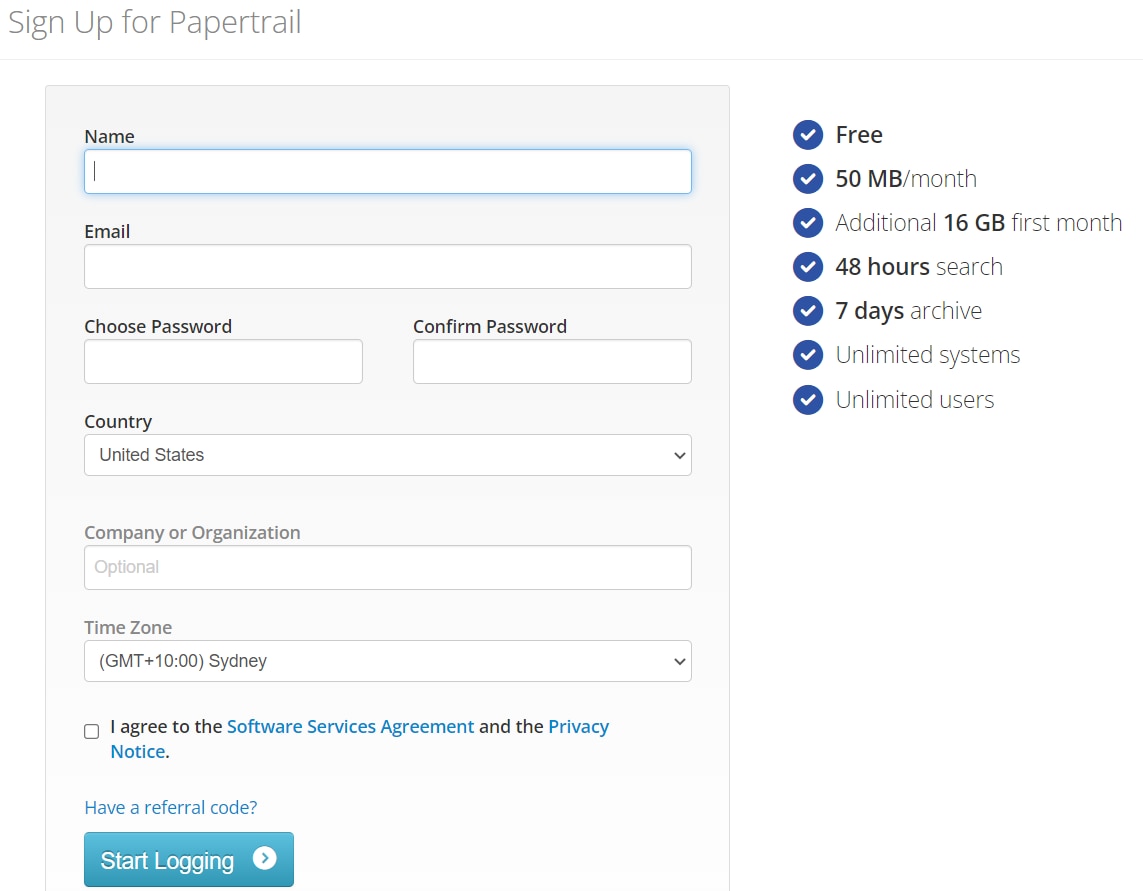
To see how it works, let’s first create a Papertrail account. The sign-up process is simple. Papertrail offers a free plan where you can store 16GB of logs for the first month. As a bonus, you can search logs up to 48 hours back, and archive logs for seven days.
 After signup, you’ll receive an email, and the next screen will prompt you to add systems to Papertrail.
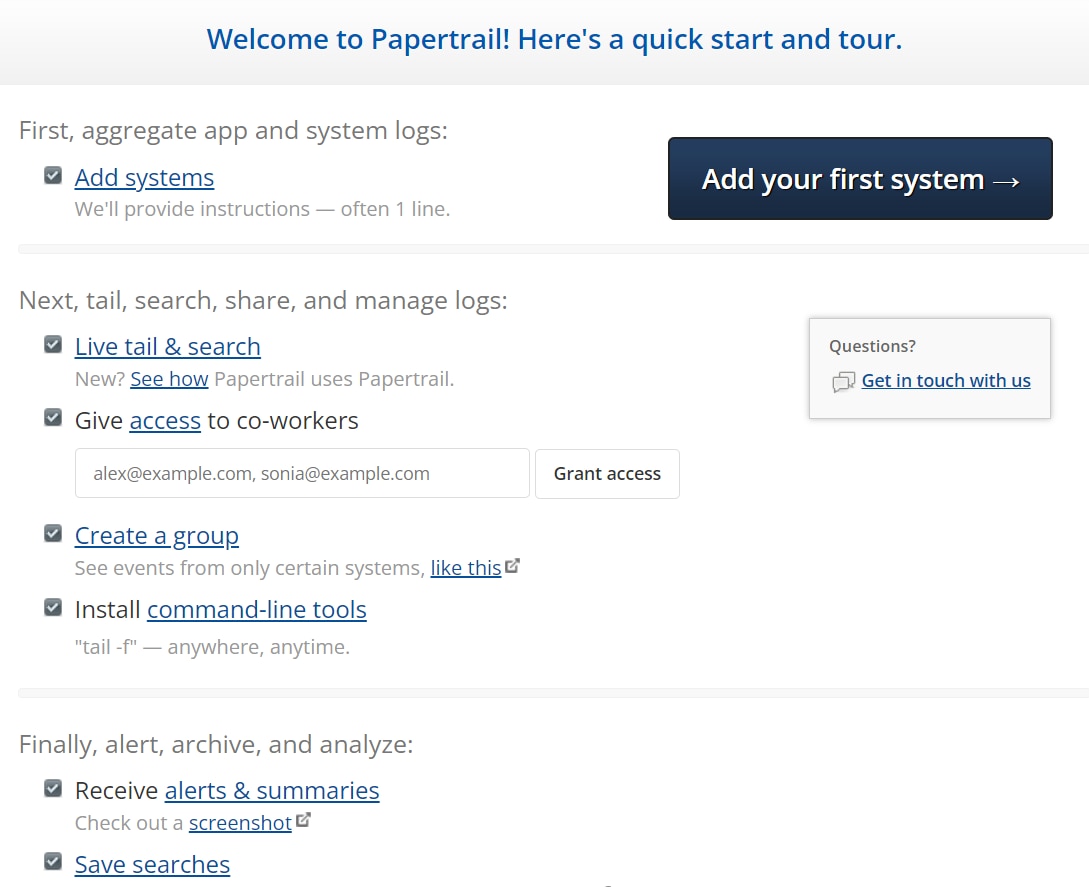
You can skip this for now and click on the
Events menu.

Since you don’t have any log sources, the
Events screen will be empty. This is where you’ll spend most of the time analyzing logs, so let’s look around.
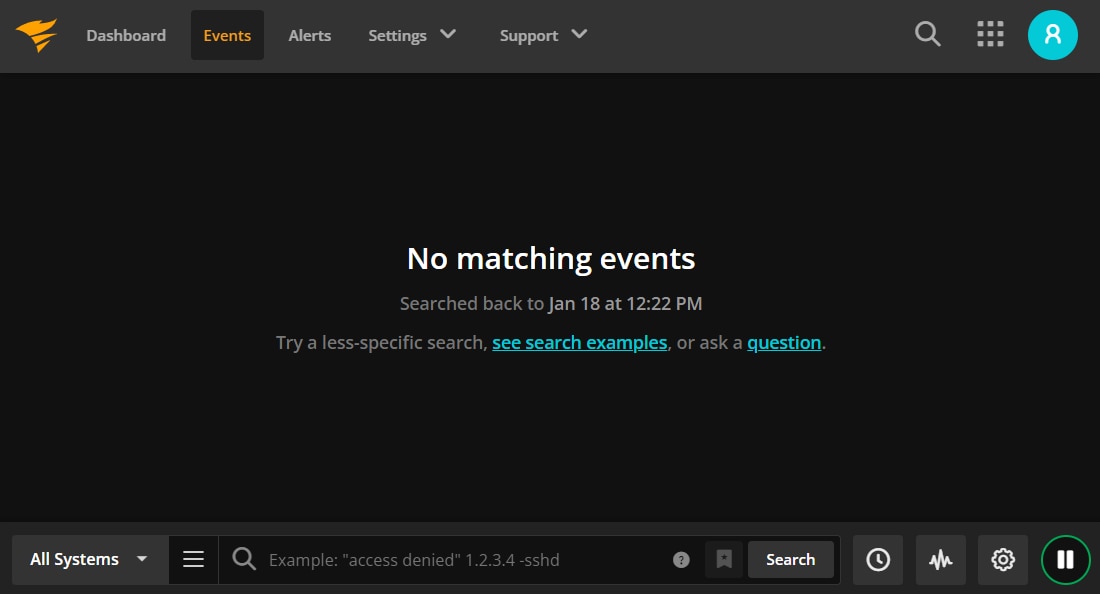
Logs captured from different sources will be displayed in the main window of this screen. At the bottom status bar, you can choose to display logs from all or specific source groups, search for a particular text or pattern in your logs, save searches, create simple trend charts from search results, jump to events on a specific date or time, and stop the logs from scrolling by.
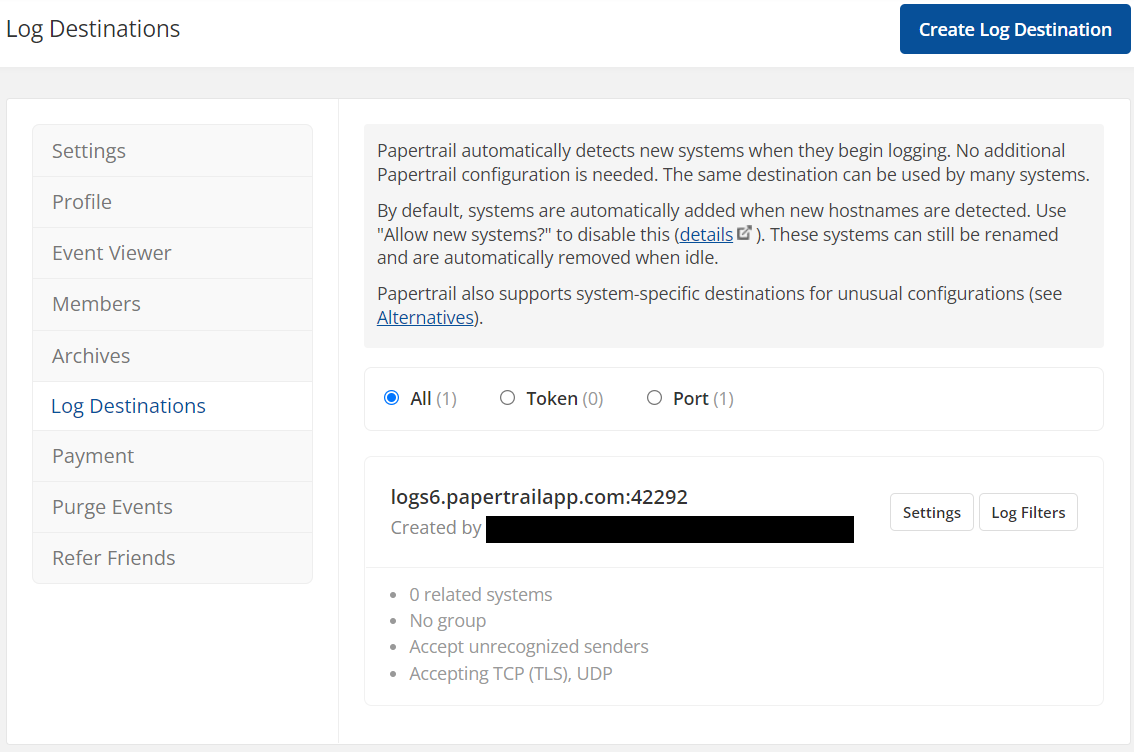
Next, select the
Settings > Log Destinations menu item, and copy the URL shown. We’ll use this URL in our WordPress setup. In our case, the URL looks like this:
The Sample WordPress Site
We created a WordPress 5.8 site in a DigitalOcean VPS from a
marketplace image. This is a simple setup where WordPress, the Apache web server, and the MySQL database server are all running on the same machine. The site has two sample blogs.

The WP Activity Log Plugin
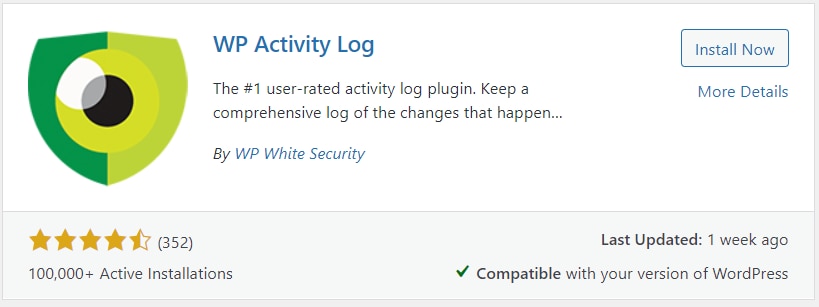
WP Activity Log is a WordPress plugin for collecting and displaying WordPress logs in the admin console or sending them to a central server. You can search for, install, and activate the plugin from the WordPress admin site.
The plugin’s premium subscription plan allows you to route logs to Papertrail. There is a 14-day free trial available which will enable you to
download and install the premium version.
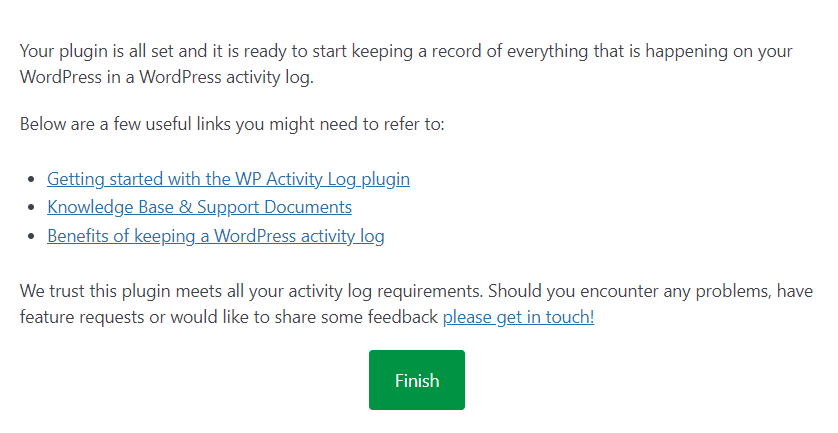
Once installed and activated, you can go through the configuration wizard, accept the default options, and click
Finish to complete the installation.
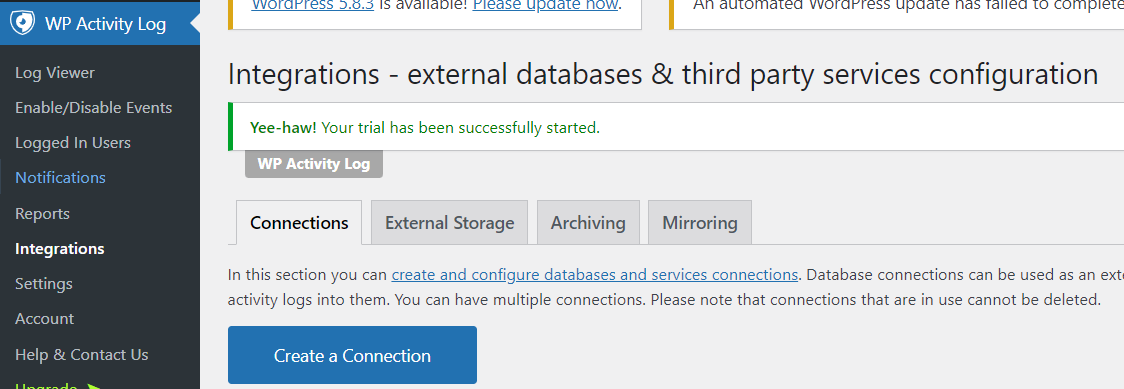
Next, from the plugin’s Integrations menu, click
Create a Connection.
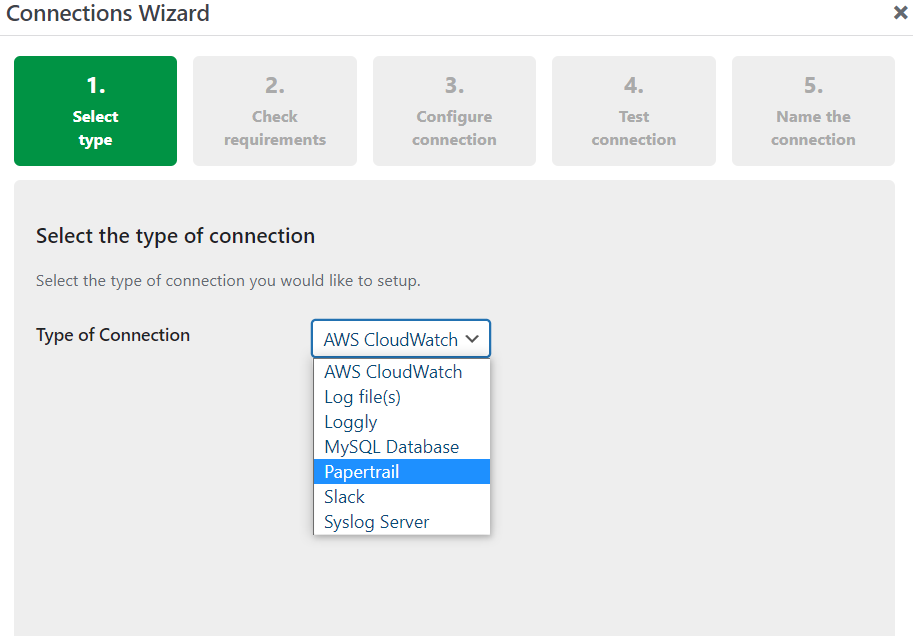
Choose
Papertrail as the type of connection.
When configuring the connection destination, paste the Papertrail URL you copied from before.
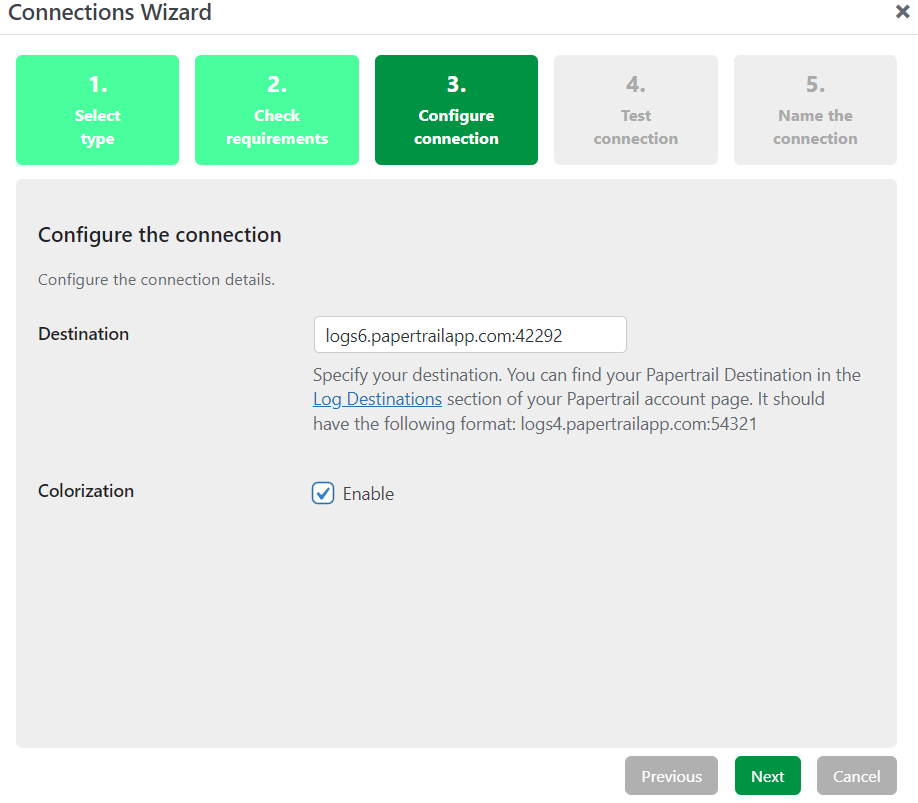
The plugin will test the connection to Papertrail and then ask you to name the connection. Finally, click on
Save Connection.
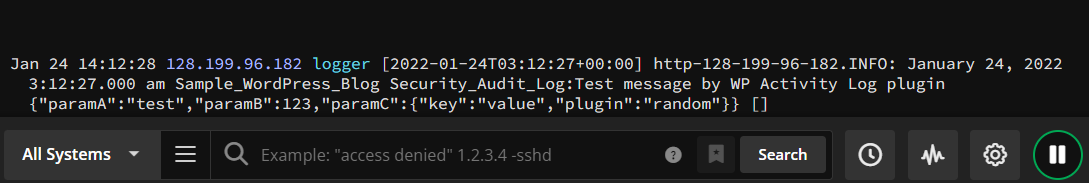
If you go to your browser tab with Papertrail, you’ll see the Events screen will show the test message sent by the plugin.
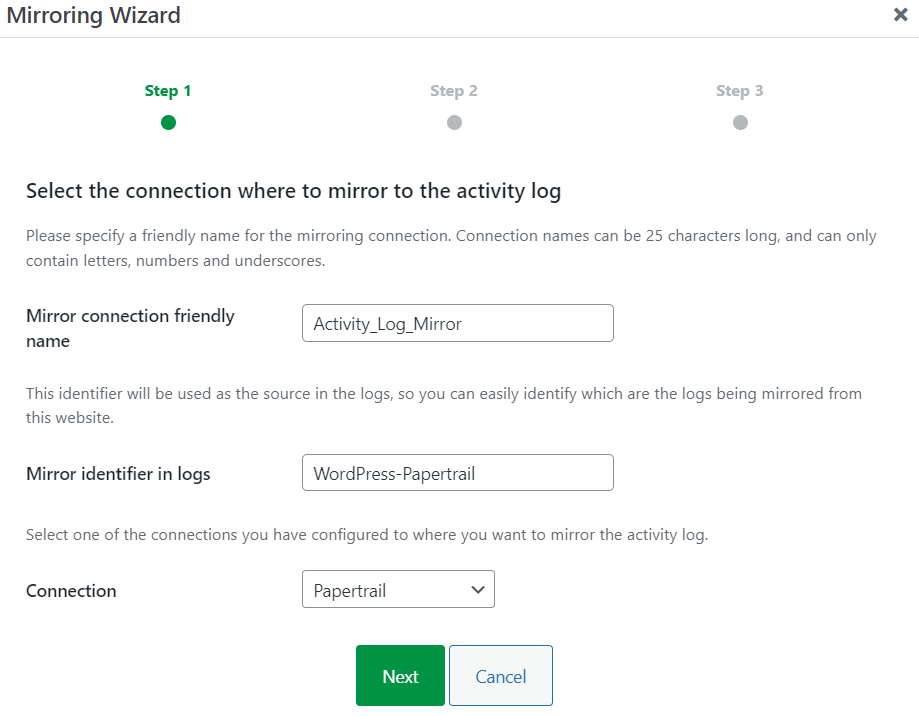
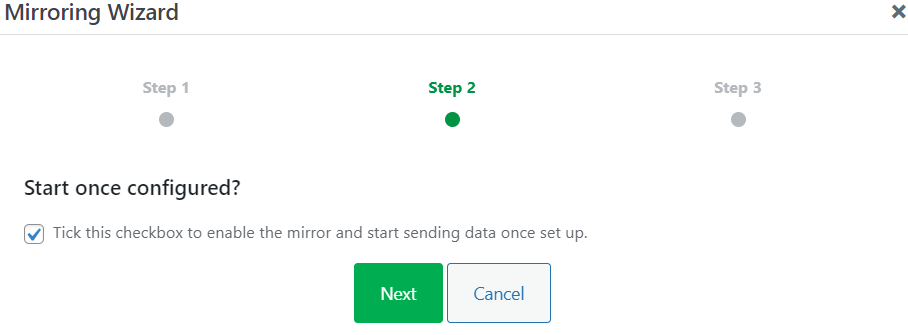
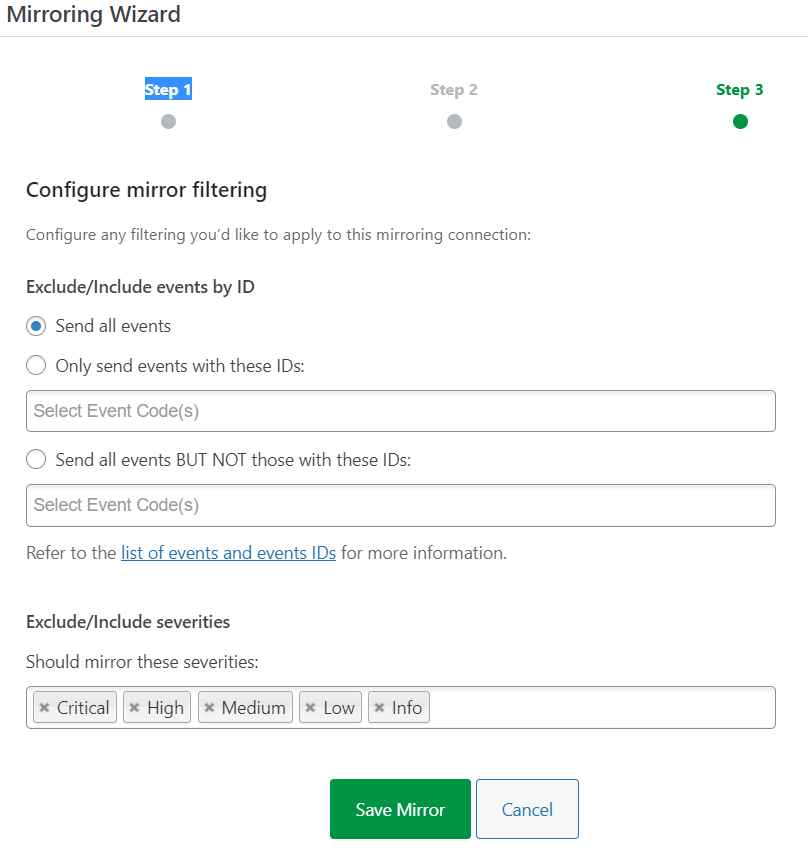
To ensure WordPress activity log messages are mirrored to Papertrail from now on, you need to configure mirroring from the plugin’s integration screen as shown below:
You’ll see messages like the following in the Papertrail events screen:
| Jan 24 19:43:58 167.71.206.181 logger [2022-01-24T08:43:57+00:00] WordPress-Papertrail.ALERT: Added a new activity log mirror Activity_log_Mirror.
…
… |
remote_syslog2 for Apache and MySQL
Apart from WordPress-related messages, you’ll also want to stream Apache and MySQL logs to Papertrail. To do this, you can use an application called
remote_syslog2, which allows you to tail events from one or more log files to a central Syslog server—in this case, Papertrail.
We won’t go into the details of installing the application as it’s
freely available from GitHub and fairly straightforward to
set up and configure. In our case, our configuration file under /etc looks like this:
| files:
- /var/log/apache2/access.log
- /var/log/apache2/error.log
- /var/log/mysql/mysql-error.log
- /var/log/mysql/mysql-general.log
- /var/log/mysql/mysql-slow.log
destination:
host: logs6.papertrailapp.com
port: 42292
protocol: tls
exclude_patterns:
- don't log on me
pid_file: /var/run/remote_syslog.pid |
Note how we included all Apache and MySQL logs here. Slow query log isn’t enabled by default, but
you can do so.
To start streaming the logs, you can run this command:
| /usr/bin/remote_syslog -c /etc/remote_syslog.yml |
To ensure the process is continuous, you can
create a systemd service unit file and enable the service to run at boot time.
Either way, running remote_syslog2 will start streaming Apache and MySQL logs to Papertrail, as shown in the images below:
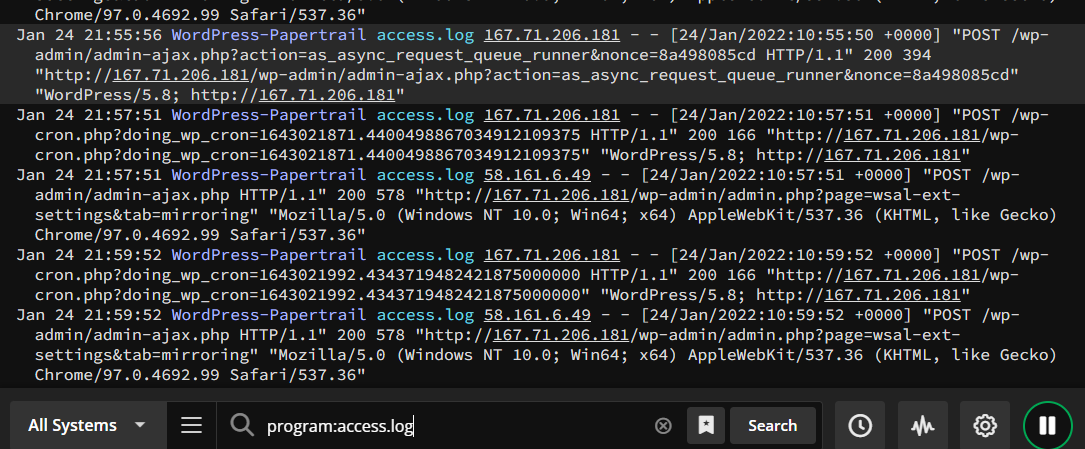
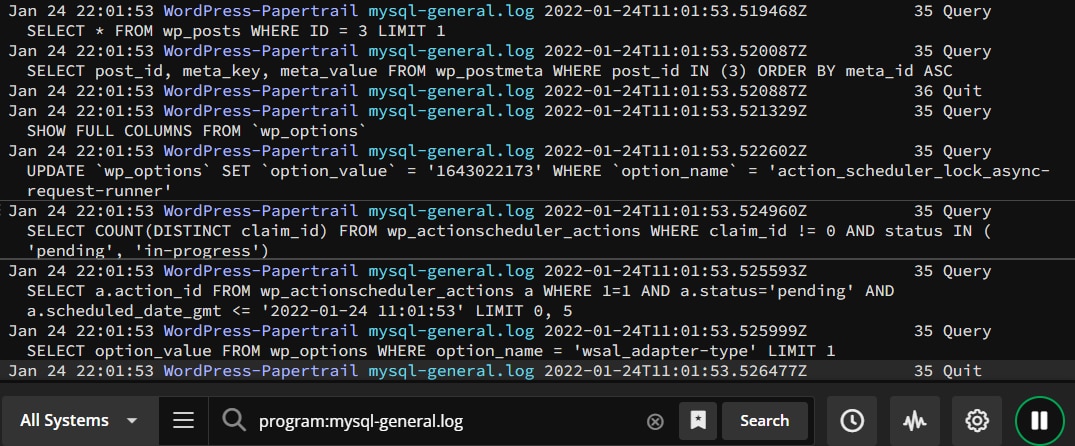
Clicking on our test blog pages and navigating the site will add more entries to the MySQL query log and Apache access log, which are aggregated to Papertrail.
Example use cases for Papertrail with WordPress
Although our sample website was small, the main purpose of this exercise was to show how to aggregate different logs to a single place for searching, filtering, analyzing, and gaining actionable insights.
Let’s consider a few use cases.
Most WordPress sites will run on a cluster of nodes in a network with a web application firewall, load balancer, and other peripheral systems around it. You can capture logs from these components into Papertrail and run a search showing all entities with the text “error” or “critical.” This can show you if anything needs your attention.
SecOps teams can rely on Papertrail for telltale signs of repeated failed login attempts, probes by bots, suspicious-looking plugins, or possible DDoS attacks.
User behavior analysis is a critical aspect of site management. Sometimes logs may show 404 or 5xx errors or timeouts on specific user actions. Papertrail can alert you to such errors. You can probe deeper into other logs or reproduce these errors in a non-production environment.
Another example is tracking data changes. The backend inventory management system of your WordPress online store may be accessible to site administrators but not developers. Running a search in Papertrail—looking for MySQL UPDATE statements against the inventory tables—can reveal non-standard, direct changes made to the backend.
Final words
In this article, we saw what Papertrail can do for the
log management of a WordPress site. We walked through how to install and configure the WP Activity Log plugin and the remote_syslog2 application to stream all the WordPress-related logs to Papertrail.
Papertrail is a powerful, fully-fledged log management solution designed to aggregate the logs from your WordPress sites to a single place, helping you to better understand what’s going on under the hood.