Broad Device Coverage from Basic to Advanced
SolarWinds Observability SaaS delivers extensive out-of-the-box device support, catering to a wide range of network equipment. After adding your devices, you can expect to see two main categories.Basic Devices: Routers, switches, hubs, and other standard network devices. These are supported right out of the box, with our SaaS observability solution providing fundamental metrics like availability, packet loss, and interface utilization, which can be seen below.

ADVANCED NETWORK EQUIPMENT: Our SaaS observability solution also covers more advanced equipment such as firewalls, load balancers, SD-WAN appliances, and wireless access points. Advanced monitoring options ensure that specialized metrics are captured for critical devices, enabling a more in-depth understanding of network behavior.
 Above, you can see how the device selector shows devices by type and provides a dynamic view of devices based on their function to rapidly surface critical status and metrics such as WAN Uplinks and Tunnel Health.
When monitoring a hybrid network with a mix of traditional and SD-WAN appliances, SolarWinds Observability SaaS helps ensure seamless monitoring across these devices without requiring any additional customization. Put simply, the out-of-the-box broad level of device support with device-specific metrics simplifies the management of your network infrastructure by
- avoiding the hassle of custom configurations for different devices.
- enabling monitoring across diverse environments with a single tool.
- supporting vendor-agnostic monitoring for heterogeneous networks.
How to Discover and Add Devices with SolarWinds Observability SaaS
“Looks good to me! So how do I add my devices?” SolarWinds Observability SaaS simplifies the discovery process with automated scanning capabilities, allowing users to quickly identify and begin monitoring devices.NO COMPLEX CONFIGURATION FILES OR “LOGIC MODULES” TO INSTALL AND MAINTAIN: Instead of requiring complex scripts or manual configurations, our SaaS observability uses intelligent device discovery to automatically find and classify network devices.
AUTOMATIC DEVICE CLASSIFICATION: The solution classifies devices by type, vendor, and role, streamlining the process of setting up monitoring policies and thresholds.
Adding any data to SolarWinds Observability SaaS is easy. The Network tab provides access to onboarding workflows, including adding single or multiple network devices and simple device discovery. Discovering your network devices is as simple as:
- Choosing the collector (Or deploying a new collector)
- Defining the range or list of IPs to scan
- Providing credentials
- Importing the results
 These powerful discovery capabilities:
- Save time and reduce manual effort during the setup phase.
- Minimize the risk of configuration errors or gaps in monitoring.
- Help ensure rapid onboarding for new devices added to the network.
Obtain Essential Health and Performance Metrics For All Monitored Devices
When things do go wrong, we know, “It's always the network,” so having access to diagnose and troubleshoot devices to prove or disprove this statement is critical. With SolarWinds Observability SaaS, device-specific views surface key metrics and attributes to:- Provide a foundation for understanding network health.
- Enable quicker identification of underperforming or overloaded devices.
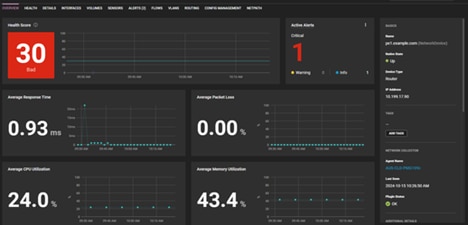
Pro Tip: Available across the solution, the compare button on the time range selector allows you to easily compare metrics across time, eliminating the need to create a new chart or dashboard.
 Time series charts will be automatically plotted with a series for the selected time range offset.
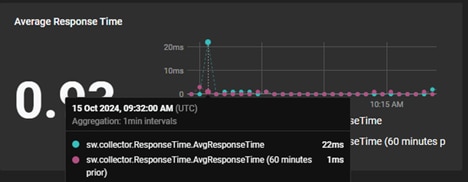 You can use this feature across the solution anywhere you work with time series data—for example, in the Analysis section, where you can work with all captured events and ingested metrics.
 Is that an anomaly you see? Yes! And it’s a sneak peek into the subject of another one of our upcoming posts where we will discuss AIOps.
Gain Deep Insight into SD-WAN, Wireless, and Firewalls
We have looked at the basic device details; let's go a little deeper. How do we meet the needs of network admins to quickly identify a degraded tunnel affecting critical branch office traffic? When going deeper into device-specific functions, SolarWinds Observability SaaS gives you the data you need to:- Provide granular visibility needed for specialized network segments.
- Enable a detailed analysis of complex environments like multi-site SD-WAN deployments.
- Help ensure that wireless coverage and security measures are effectively managed.
SD-WAN MONITORING: To efficiently observe and manage SD-WAN devices, we track link performance and tunnel health across Aruba, Fortinet, Meraki, Palo Alto, VeloCloud, and Viptella devices. This gives you the details needed to gain visibility into WAN health and link usage to optimize connectivity and user experience.
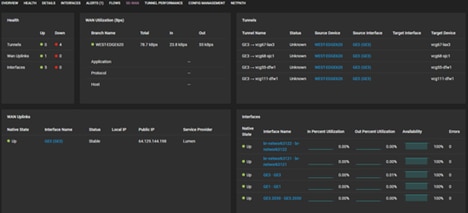
WIRELESS NETWORK INSIGHTS: We also provide broad vendor coverage for wireless solutions from Aruba, Cisco, HP, Dell, Meraki, Meru, Ruckus, and Symbol Technologies, which surfaces critical information for monitoring signal strength, user connections, and access point health. This is essential in helping identify potential coverage issues or bandwidth hogs affecting wireless performance.

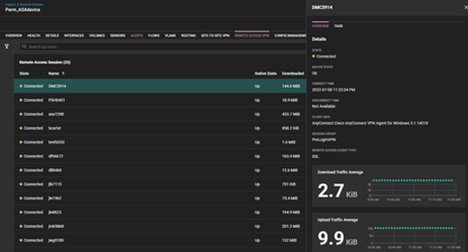
FIREWALL ANALYTICS: Who is connected? What is connected? Are my tunnels up? At what phase are they failing? What VPN clients are connecting? Luckily for network admins, these questions can be answered easily with the Site-to-Site and remote access VPNs tab on supported firewalls.

 With all these powerful capabilities at your disposal, it’s easy to see how SolarWinds Observability SaaS reduces time to value, mean time to detection, and mean time to remediation. And we haven’t even looked at some of the solution's other fundamental features.
Configurable, intelligent alerts for critical metrics proactively address potential issues before they impact the network. Do you want to learn more about alerts? Stay tuned to further blog posts where we will take an in-depth look at the alerting engine and its integration with the SolarWinds Service Management solution.
Customizable Dashboards: Visualize the status of network devices through dashboards that can easily be tailored to highlight key performance indicators (KPIs). You can learn more about our powerful and customizable Dashboards here.
