Statistical Process Control (SPC), or using numbers or data to study the characteristics of our process to make it behave the way we want it to behave, has been around since 1924 and was invented by Walter Shewhart. It has been widely adopted in manufacturing, logistics, and other operationally focused parts of the business world; but seems less well known in the world of systems administration and web operations. It’s part of the core curriculum in every business school in the world. Not that it really matters for IT folks, but it strikes me as strange that it’s not more common in the monitoring world.
Etsy’s release of
Skyline uses algorithms common to SPC is a huge win for filtering out noise from metrics and threshold-based systems. In computer systems, improbable things happen more than you’d predict, and SPC methods aren’t good enough at preventing false positives. They're useful for filtering out the noise, but many users will experience many false positives even with SPC. Many of the SPC formulas are written for a process with a stable mean, meaning they measure the output of an end product (e.g., a drill hole size, or a defect rate), not dynamically changing metrics. The choice of metrics becomes particularly important when you apply SPC to IT monitoring because there isn’t a good analogy that translates to the computer world.
Nonetheless, Western Electric published a book in 1956 called the “
Statistical Process Control Handbook,” which has some very useful rules for detecting anomalies and might be helpful to those implementing SPC in IT systems.
The rules attempt to distinguish unnatural patterns from natural patterns based on several criteria:
- The absence of points near the centerline
- The absence of points near the control limits
- The presence of points outside the control limits
- Other unnatural patterns (systematic (autocorrelative), repetition, trend patterns)
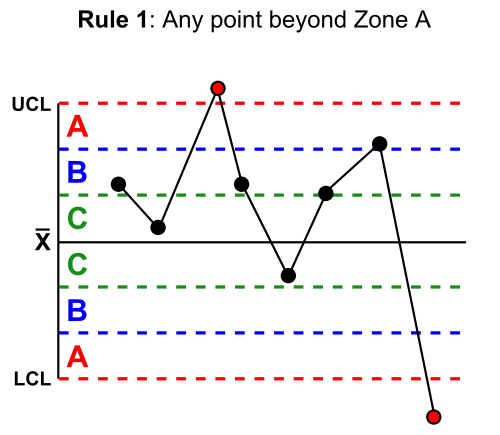
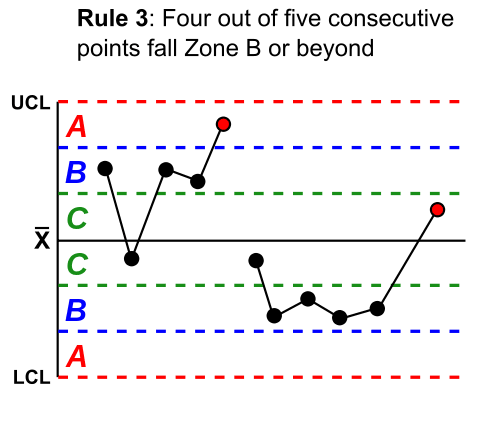
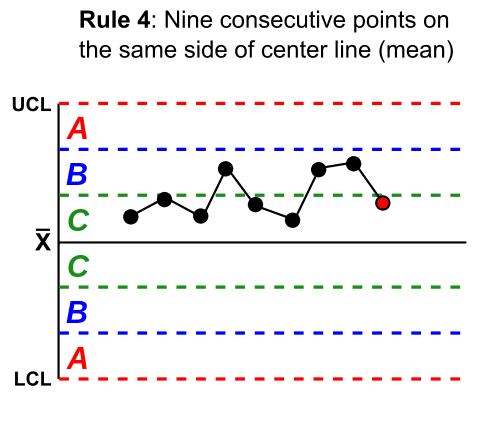
To achieve this, the rules divide the chart into zones, measured in units of standard deviation (σ) between the centerline and control limits, as 1, 2, and 3 standard deviations from the mean. In the following examples, the red line is 3 standard deviations, the blue line is 2 standard deviations, and the green line is 1 standard deviation, although these can vary based on business needs.
The
Western Electric rules are as follows (image credits to Wikipedia):

Another similar set of rules is the
Nelson rules.
Although the rules aren’t perfect, with adaptations such as exponential moving averages, it’s a significant improvement over static thresholds, and can be implemented cheaply. The results can be very useful — again, see
skyline and
oculus.
As John Allspaw has repeatedly
demonstrated, the DevOps world has a lot to learn from other fields, such as mechanical engineering and flight control systems.