Let’s talk a bit about free space in buffer, what SQL Sentry Performance Advisor is showing you, and what it means.
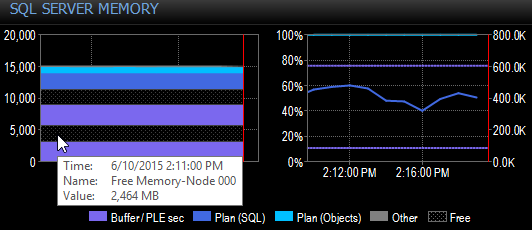
What I’m referring to is illustrated in following screenshot:
*Note: On the right side of this visualization, you can see an example of PLE being vastly different between NUMA nodes. This type of imbalance is something to keep an eye out for when monitoring SQL Server memory on modern systems.
On this server I’m showing 2.5GB worth of free space in the data buffer for node 0 (this server has 2 NUMA nodes).
I’ve seen some confusion over exactly what this is a few times, so I wanted to take a few minutes to clarify it.
There’s a really great post by Paul Randal (b|t) in which he describes a performance problem involving free space on pages in buffer. I’ve seen several people make the assumption that this is the measurement being displayed on the SQL Server memory chart in SQL Sentry.
While SQL Sentry does provide this type of information, it is part of Fragmentation Manager. There you can find a historical breakdown of index space usage including free and used space, both on disk and in buffer.
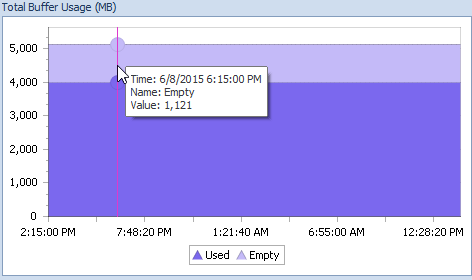
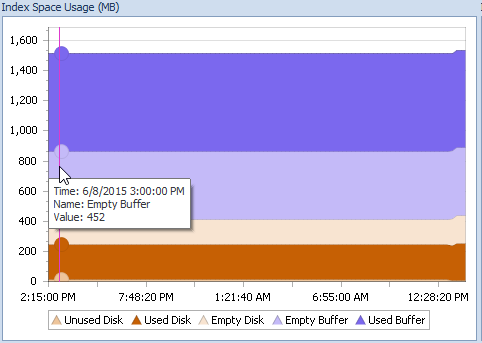
To illustrate the difference, here are two charts from Fragmentation Manager:
This is buffer space at the server level including wasted space (Empty) and used space:
This is a specific index on the server that demonstrates some wasted space (Empty) in buffer:
*Note: The above visualizations are from a different time range than the dashboard visualization, but from the same server. This illustrates how these values can change over time based on usage and/or maintenance patterns for thee database.
As Paul mentions in his post, a query to get this information server-wide won’t always perform so well. Since SQL Sentry provides near real-time performance measurements, the overhead placed on the server by running that query often would not be in-line with our goal of keeping observer overhead to a minimum.
The value in the memory chart is actually from a performance counter; which counter depends on which SQL Server version is being monitored. In 2005, 2008, and 2008 R2, it is SQL Server: Buffer Node – Free Pages multiplied by the 8kb page size and converted to MB. In 2012 and up, it is SQL Server: Memory Node – Free Node Memory (KB) converted to MB.
These counters are a measurement of buffer pages that are not in use. They indicate buffer space that SQL Server can use for other things. They do not indicate “wasted” space in your buffer. High values for this measurement are not necessarily a problem at all. It just means that you’ve used that space in the buffer at some point, but it is not currently in use. In fact, if this measurement were to be considered part of a performance problem, it would likely be smaller rather than larger.
If you consistently have a very large amount of free space here, and you’re in a virtualized environment, you may be able to reclaim some resources. But keep in mind: the space was used at some point, and could easily be needed again.
I should note that this measurement by itself is not all that useful at all. It becomes far more interesting when displayed along with other metrics like PLE, lazy write activity, and I/O Latency, which is why it isn’t on the dashboard all alone.
So the next time you see this on your SQL Server Memory dashboard chart, remember that it’s not so much wasted space on pages that you’re seeing, but free space measured in complete pages.


