What’s the Environment Health Overview?
The SentryOne Environment Health Overview is one of the most exciting features introduced in SentryOne v11. It is a Start Page-integrated dashboard that leverages SentryOne’s industry-leading advisory engine to deliver at-a-glance health status for your environment using an overall “score” and other visual indicators. This health score uses a 100-point scale, and is based on several factors including the severity, number, and age of the advisory events, as well as the number of servers you’re monitoring.
Don’t have our software yet? Get a free trial here and follow along below for 6 ways to use the Environment Health Overview.
Turn it on
If you’re just getting started with SentryOne, this happens as part of the setup wizard, but I know a many people reading this come from “the old days,” when we were SQL Sentry, and you had Performance Advisor and Event Manager. The wizard doesn’t run automatically if you are upgrading, so to take full advantage of the Environment Health Overview, there is an easy way to get on equal footing.
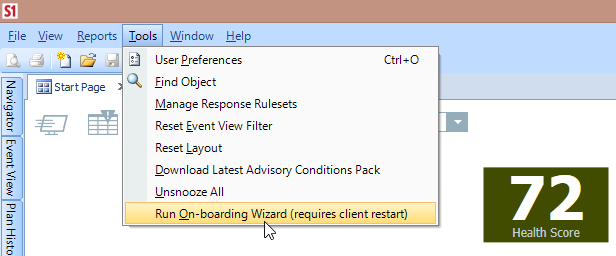
All you need to do is run through the wizard manually. This is a menu option, under Tools in the client:

Make sure you’re prepared to run it now, because the client will close and launch you into the wizard. You’ll get all the same configuration options you would get if you were doing a brand new installation, but best of all it will configure all of the Advisory Conditions to work with your performance dashboards, event calendars, and the Environment Health Overview.
Make sure the start page is the first thing you see
Similar to the previous tip, there are probably many of you who have been using our software tools for years. The overview occupies a portion of the start page. We added the start page some time ago to let everyone know when there were new blog posts and articles, and to help evaluators get started with major features. It is possible that many people never see the overview, because the start page is not the first thing they see.
In the client, under Tools -> User Preferences, you can change where you start in the client. Just change this to “Start Page” and you’ll get the overview every time you start up the client:

Use the severity and resource tag filters to focus your efforts
In a large environment with many servers, or even a smaller environment with few servers that need a lot of attention, you may see a high volume of Advisory Condition events.
When you’re working through the list of events to get things running smoothly, it helps to focus on the big things first. There will be plenty of time later to work through less severe events.
On the Environment Health Overview, we display two “wedgets.” One sees the world in terms of severity, and the other sees it in terms of resources. These can be used to filter the list of events by selecting either one of the wedges or colored boxes with the event count:

What some may not realize is that you can filter on both of these at the same time. In this next image, I’m looking for critical events related to storage performance:

Keep things tidy
If you really want to get your health score up, you should close events out once corrective action has been taken. For that, you’ll need to open the events log. The easiest way is to use the link on the events list in the overview:

From here, you can add notes to the event, assign it to someone else, or close it out. I’ll assign these low severity CPU warnings to Greg, so he can take care of my light work.

You might notice that I have several of those events. What you can’t see is that I have many more than are displayed in the screenshot. If I’ve resolved the issue, I can simply use the right-click menu to close all of them at once:

Keeping the events list cleaned up will show the progress you’ve made over time, and help keep your health score as close to the elusive 100 as you can get.
Use the time slicers
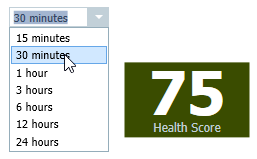
As data professionals, there are times when the results of our heroic efforts are a lagging indicator. You might reconfigure tempdb today, but the increased performance may not be noticed until the ETL load tomorrow morning. As you work through the events list in the overview, you can trim down the time range using the slicers. You can see the score for anywhere from 15 minutes to 24 hours. If you aren’t seeing the change you want right away, try a lower time range to get an idea of how much impact the changes you’re making will have.

Show your boss
You work hard, and you deserve credit for the progress and improvements you make. If you’ve kept your score high, or even moved it from low to high, be proud of what you’ve accomplished. Make sure people know about it!
By the way, if you haven’t noticed, a score of 100 is difficult to achieve with all the default Advisory Conditions enabled. If you’ve reached or are approaching 100, you definitely deserve a high five.

In closing…
The Enviroment Health Overview is just one of many features in SentryOne designed to make life a little better for data professionals.
Give it a shot; you’ve got nothing to lose other than the mystery surrounding what is actually happening across your server environment.
Until next time,
-JRH


