If you’ve read my posts for any length of time, you know I sometimes get caught up in side projects. Whether it’s
writing an eBook, creating a series of blog posts about
custom SolarWinds reports, or figuring out
how to make JSON requests in Perl, when my ADD and inspiration team up to conspire against me, I have no choice but to follow. The good news is I usually learn something interesting along the way.
That’s what this series of posts is going to be about—yet another trip down the technical rabbit hole of my distractibility. Specifically, I implemented Pi-Hole on a spare Raspberry Pi at home, and then decided it needed to be monitored.
In the first part of the series (today’s post), I’m going to give some background on what Pi-Hole and the Raspberry Pi are and how they work. In the next installment, I’ll cover how to monitor it using SolarWinds Server & Application Monitor (SAM).
If you’re impatient, you can download all three of the templates I created from the THWACK content exchange. The direct links are here:
Please note these are provided as-is, for educational purposes only. Do not hold the author, the author’s company, or the author’s dog responsible for any hair loss, poor coffee quality, or lingering childhood trauma.
This is a whole computer on a 3.5” x 2.25” board. For those who haven’t had exposure to these amazing little devices, a Raspberry Pi is a small, almost credit-card-sized full computer on a single board. It has a CPU, onboard memory, GPU, and support hardware for a keyboard, mouse, monitor, and network connection.
While most people use the operating system “Raspbian” (a Linux Debian variation), it also supports several other OS options built off variants of Linux, RISC, and even Microsoft Windows.
Pi-Hole software makes your home (or, work, if your IT group is open-minded enough) network faster and safer by blocking requests to malicious, unsavory, or just plain obnoxious sites. If you’re using Pi-Hole, it’ll be most noticeable in the ways advertisements on a webpage load:
BEFORE: pop-overs and hyperbolic ads.


***********************
AFTER: No pop-overs, spam ads blocked

But under the hood, it’s even more significant:
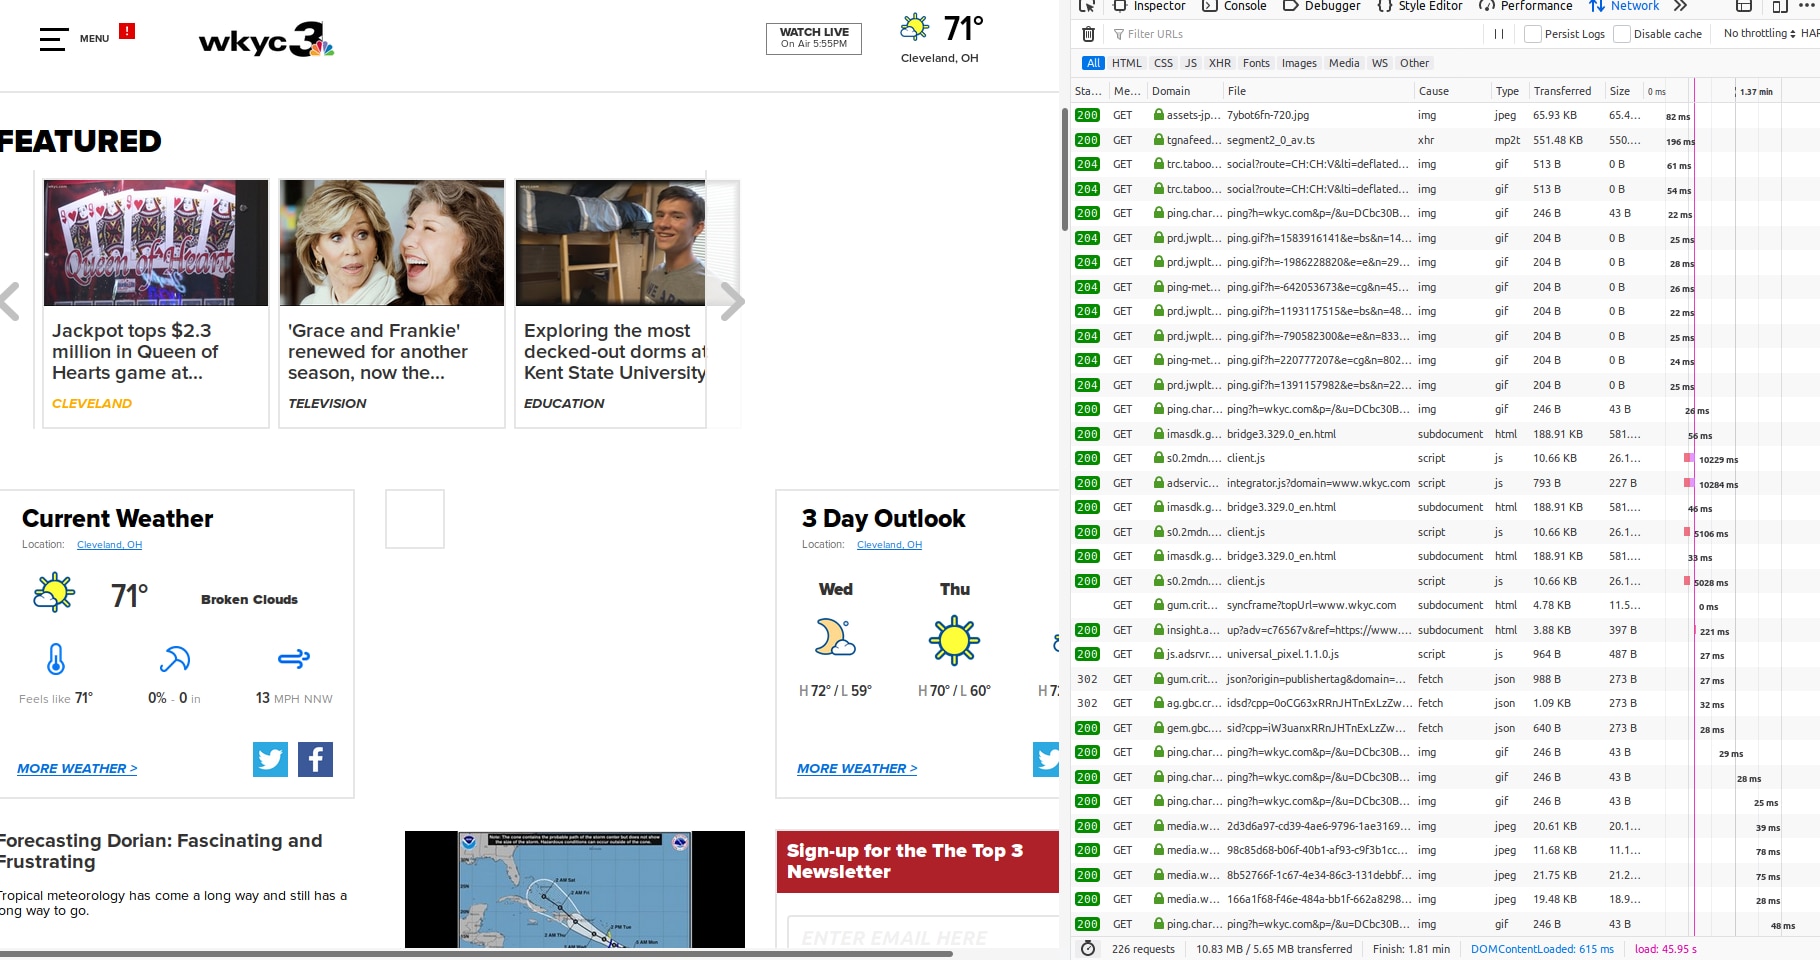
BEFORE: 45 seconds to load
*****************
AFTER: 6 seconds to load
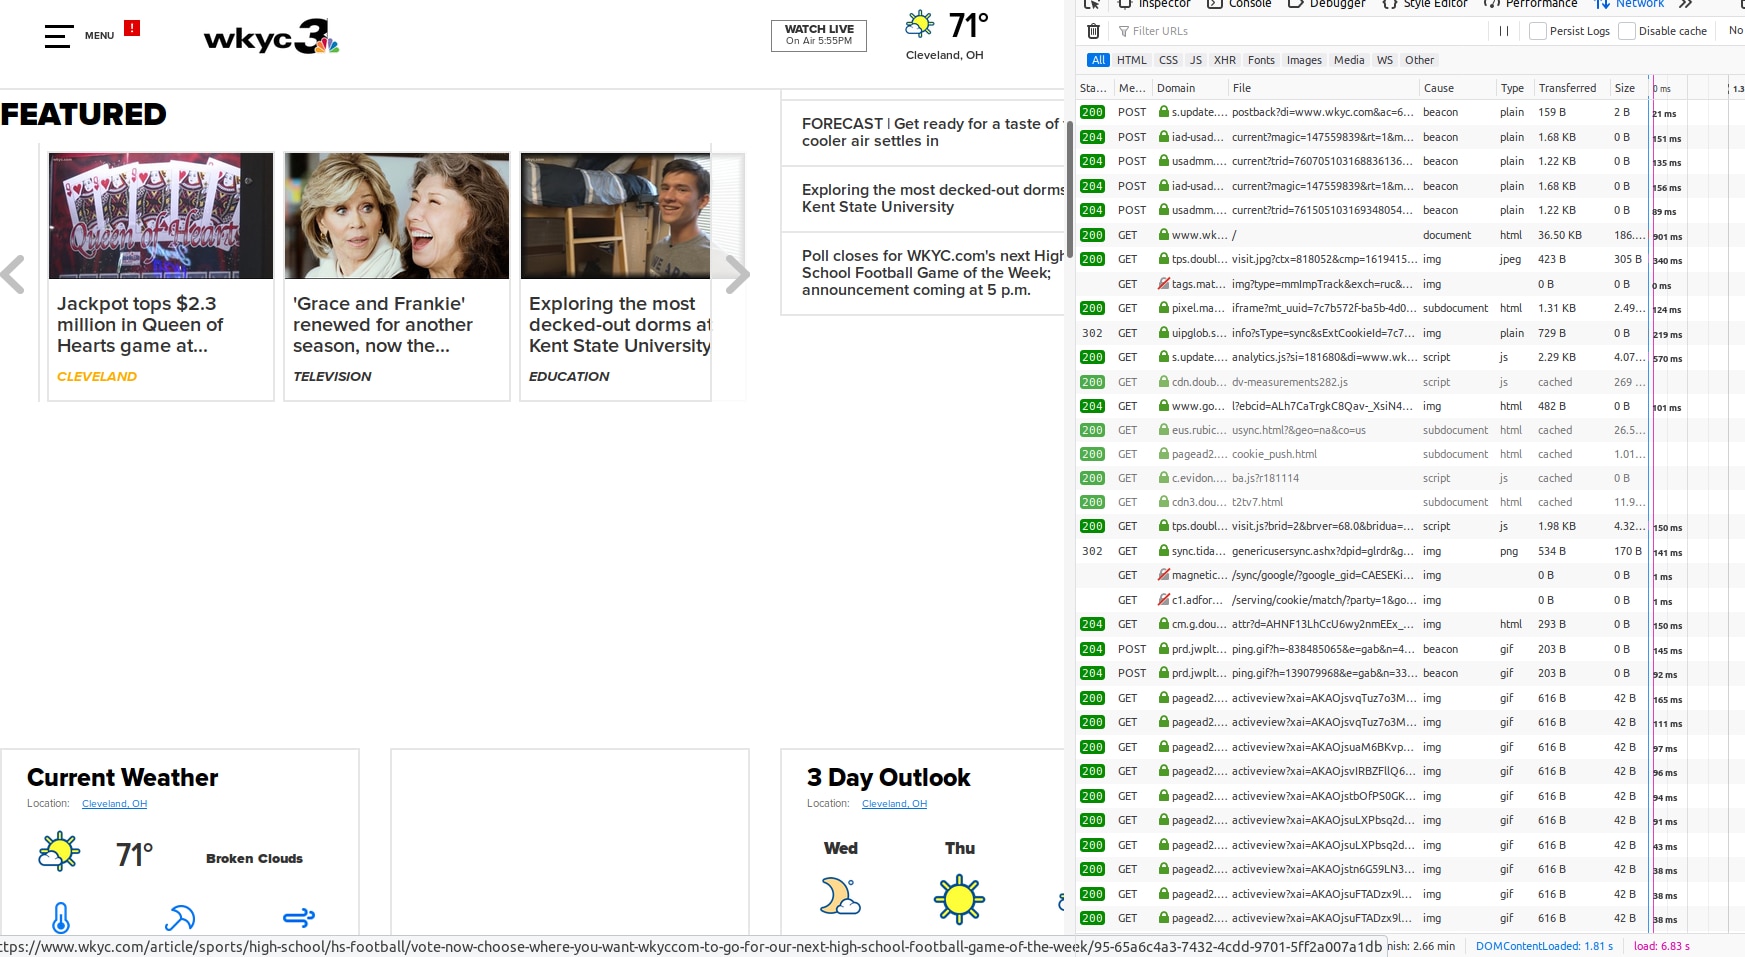
Look in the lower-right corner of each of those images. Load time without Pi-Hole was over 45 seconds. With it, the load time was 6 seconds.
You may not think there are many of these, but your computer is making calls out to these sites all the time. Here are the statistics from my house on a typical day.

The Pi-Hole software was originally built for the Raspberry Pi, but has since extended to run on full computers (or VMs) running Ubuntu, CentOS, Debian, or Fedora; or on docker containers hosted on those systems. That said, I’m focusing on the original, Raspberry Pi-based version for this post.
What Is This API?
If you’ve already dug into APIs as part of your work, you can probably skip this section. Otherwise, read on!
An Application Programming Interface is a way of getting information out of (or sometimes into) a program without using the normal interface. In the case of Pi-Hole, I could go to the web-based admin page and look at statistics on each screen, but since I want to pull those statistics into my SolarWinds monitoring system, I’m going to need something a bit more straightforward. I want to be able to effectively say directly to Pi-Hole, “How many DNS queries have you blocked so far today?” and have Pi-Hole send back “13,537” without all the other GUI frou-frou.
SHAMELESS PROMOTION: If you find the idea of APIs exciting and intriguing, then I should point you toward the SolarWinds Orion Software Developer Kit (SDK)—a full API supporting the language of your choice (Yes, even Perl. Trust me.
I tried it.). There’s a whole
forum on THWACK dedicated to it. Head over there if you want to find out how to add nodes, assign IP addresses, acknowledge alerts, and other forms of monitoring wizardry.
How Does the Pi-Hole API Work?
If you have Pi-Hole running, you get to the API by going to http://<your pi-hole url>/admin/api.php.
There are two modes to extracting data—summary and authorized. Summary mode is what you get when you hit the URL I gave above. It will look something like this:
{”domains_being_blocked”:115897,”dns_queries_today”:284514,”ads_blocked_today”:17865,
”ads_percentage_today”:6.279129,”unique_domains”:14761,”queries_forwarded”:216109,
”queries_cached”:50540,”clients_ever_seen”:38,”unique_clients”:22,
”dns_queries_all_types”:284514,”reply_NODATA”:20262,
”reply_NXDOMAIN”:19114,”reply_CNAME”:16364,”reply_IP”:87029,
”privacy_level”:0,”status”:”enabled,””gravity_last_updated”:{”file_exists”:true,
”absolute”:1567323672,”relative”:{”days”:”3,””hours”:”09,””minutes”:”53”}}}
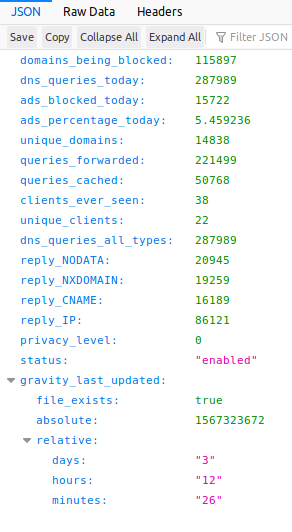
If you look at it with a browser capable of formatting JSON data, it looks a little prettier:
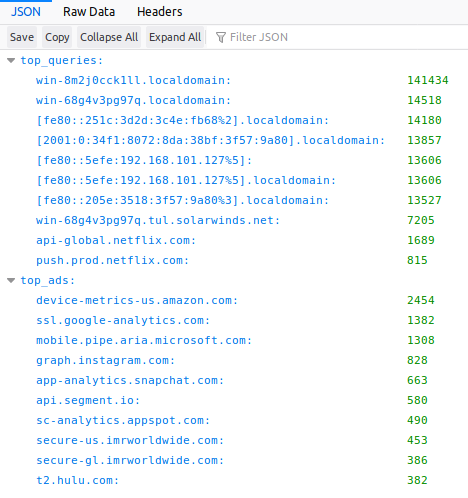
Meanwhile, the authorized version is specific to certain data elements and requires a token you get from the PiHole itself. You view the stats by adding ?”<the value you want>” along with “&auth=<your token>” to the end of the URL, so to get the TopItems data, it would look something like this:
http://192.168.101.10/admin/api.php?topItems&auth=0123456789abcdefg012345679
And the result would be:
You get a token by going to the Pi-Hole dashboard, choosing Settings, clicking the “API/Web Interface” tab, and clicking the “Show Token” button. Meanwhile, the values requiring a token are described on the
Discourse page for the Pi-Hole API.
Until Next Time
That’s it for now. In my next post of the series, I’ll dig deep into building the SAM template. Your homework is to repurpose, dust off, or buy a Raspberry Pi, load it up with Pi-Hole, and get it configured. Then you’ll be ready to try out the next steps when I come back.
And if you want to have those templates ready to go, you can download them here:

 ***********************
AFTER: No pop-overs, spam ads blocked
 But under the hood, it’s even more significant:
BEFORE: 45 seconds to load
 *****************
AFTER: 6 seconds to load
 Look in the lower-right corner of each of those images. Load time without Pi-Hole was over 45 seconds. With it, the load time was 6 seconds.
You may not think there are many of these, but your computer is making calls out to these sites all the time. Here are the statistics from my house on a typical day.
 The Pi-Hole software was originally built for the Raspberry Pi, but has since extended to run on full computers (or VMs) running Ubuntu, CentOS, Debian, or Fedora; or on docker containers hosted on those systems. That said, I’m focusing on the original, Raspberry Pi-based version for this post.
 Meanwhile, the authorized version is specific to certain data elements and requires a token you get from the PiHole itself. You view the stats by adding ?”<the value you want>” along with “&auth=<your token>” to the end of the URL, so to get the TopItems data, it would look something like this:
http://192.168.101.10/admin/api.php?topItems&auth=0123456789abcdefg012345679
And the result would be:
 You get a token by going to the Pi-Hole dashboard, choosing Settings, clicking the “API/Web Interface” tab, and clicking the “Show Token” button. Meanwhile, the values requiring a token are described on the Discourse page for the Pi-Hole API.


