Back in October, 2019, I shared my love of both Raspberry Pi (
https://www.raspberrypi.org/) devices and the Pi-Hole (
https://pi-hole.net/) software; and showed how—with a little know-how about Application Programming Interfaces (APIs) and scripting (in this case, I used it as an excuse to make my friend
@kmsigma happy and expand my knowledge of PowerShell) you could fashion a reasonable API-centric monitoring template in Server & Application Monitor (
SAM). For those who are curious, you can find part 1 here:
Don’t Shut Your Pi-Hole, Monitor It! (part 1 of 2) and part 2 here:
Don’t Shut Your Pi-Hole, Monitor It! (part 2 of 2)
It was a good tutorial, as far as things went, but it missed one major point: even as I wrote the post, I knew
@Serena and her daring department of developers were hard at work building an API poller into SAM 2019.4. As my tutorial went to post, this new functionality was waiting in the wings, about to be introduced to the world.
Leaving the API poller out of my tutorial was a necessary deceit at the time, but not anymore. In this post I’ll use all the same goals and software as my previous adventure with APIs, but with the new functionality.
A Little Review
I’m not going to spend time here discussing what a Raspberry Pi or Pi-Hole solution is (you can find that in part 1 of the original series:
Don’t Shut Your Pi-Hole, Monitor It! (part 1 of 2) . But I want to take a moment to refamiliarize you with what we’re trying to accomplish.
Once you have your Raspberry Pi and Pi-Hole up and running, you get to the API by going to http://<your pi-hole IP or name>/admin/api.php. When you do, the data you get back looks something like this:
{”domains_being_blocked”:115897,”dns_queries_today”:284514,
”ads_blocked_today”:17865,”ads_percentage_today”:6.279129,
”unique_domains”:14761,”queries_forwarded”:216109,
”queries_cached”:50540,”clients_ever_seen”:38,
”unique_clients”:22,”dns_queries_all_types”:284514,
”reply_NODATA”:20262,”reply_NXDOMAIN”:19114,”reply_CNAME”:16364,
”reply_IP”:87029,”privacy_level”:0,”status”:”enabled,”
”gravity_last_updated”:{”file_exists”:true,”absolute”:1567323672,”relative”:{”days”:”3,””hours”:”09,””minutes”:”53”}}}
If you look at it with a browser capable of formatting JSON data, it looks a little prettier:
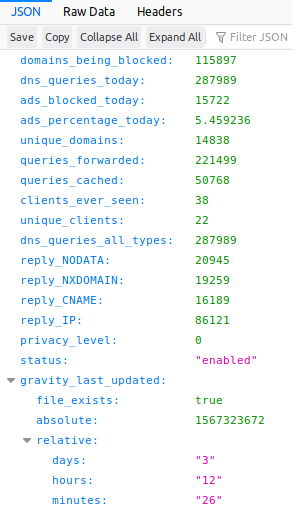
That’s the data we want to collect using the new Orion API monitoring function.
The API Poller – A Step-by-Step Guide
To start off, make sure you’re monitoring the Raspberry Pi in question at all, so there’s a place to display this data. What’s different from the SAM Component version is you can monitor it using the ARM agent, or SNMP, or even as a ping-only node.
Next, on the Node Details page for the Pi, look in the “Management” block and you should see an option for “API Poller.” Click that, then click “Create,” and you’re on your way.

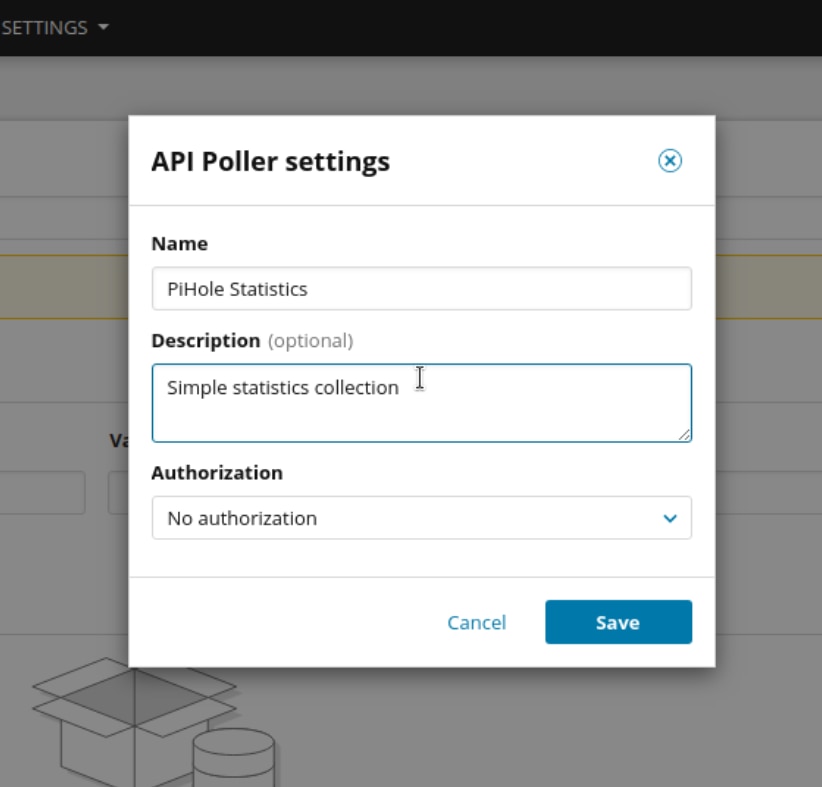
You want to give this poller a name, or else you won’t be able to include these statistics in PerfStack (Performance Analyzer) later. You can also give it a description and (if required) the authentication credentials for the API.
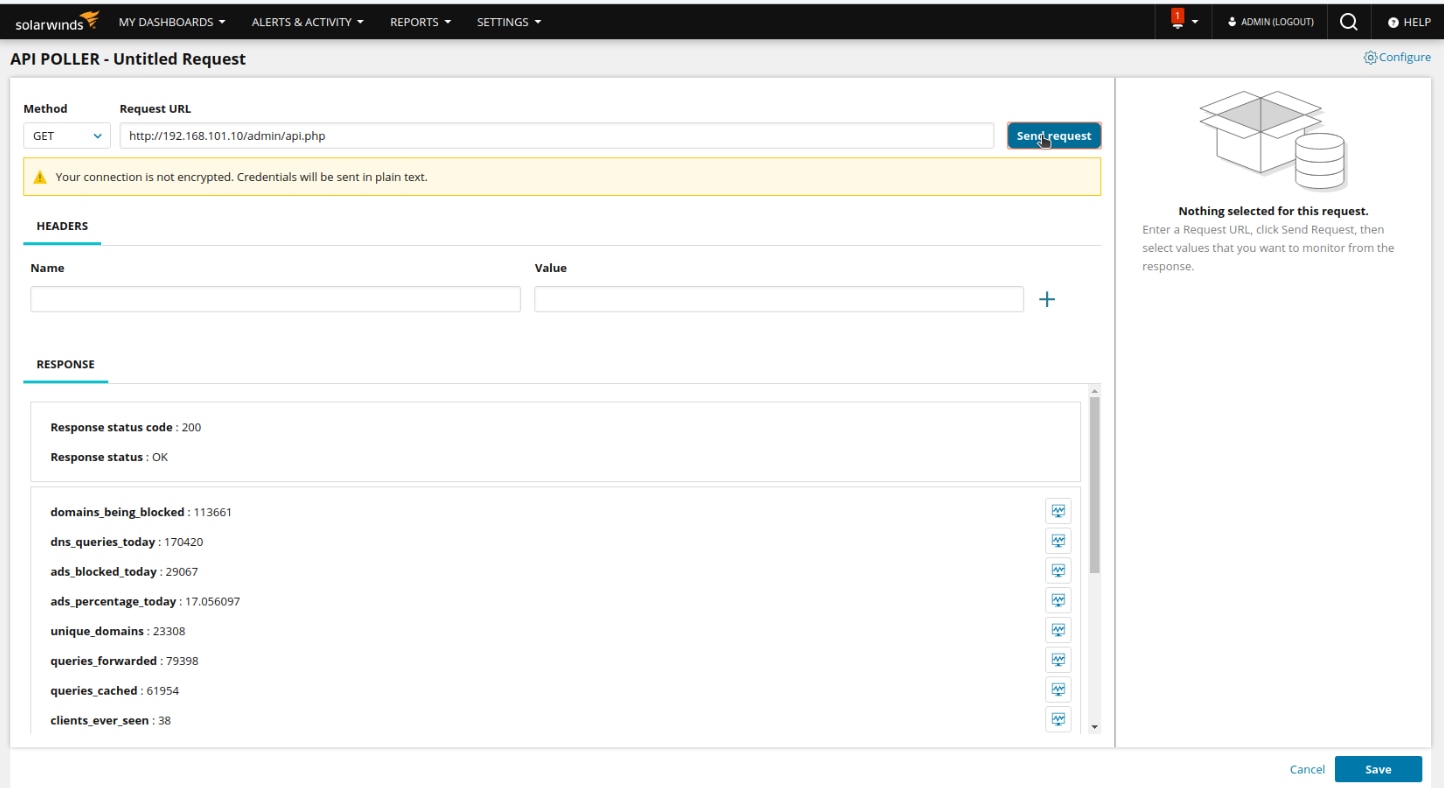
On the next screen, put in the Pi-Hole API URL. As I said before, that’s http://<your pi-hole IP or Name>/admin/api.php. Then click “Send Request” to pull a sample of the available metrics.

The “Response” area below will populate with items. For the ones you want to monitor, click the little computer screen icon to the right.
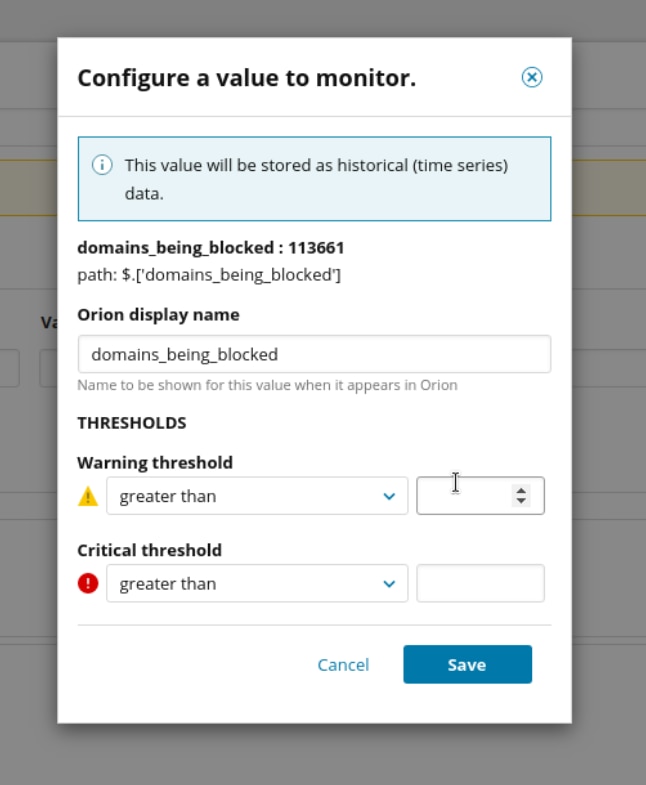
If you want to monitor the value without warning or critical thresholds, click “Save.” Otherwise change the settings as you desire.
As you do, you’ll see the “Values to Monitor” list on the right column populate. Of course, you can go back and edit or remove those items later. Because nobody’s perfect.

Once you’re done, click “Save” at the bottom of the screen. Scroll down on the Node Details page and you’ll notice a new “API Pollers” Section is now populated.
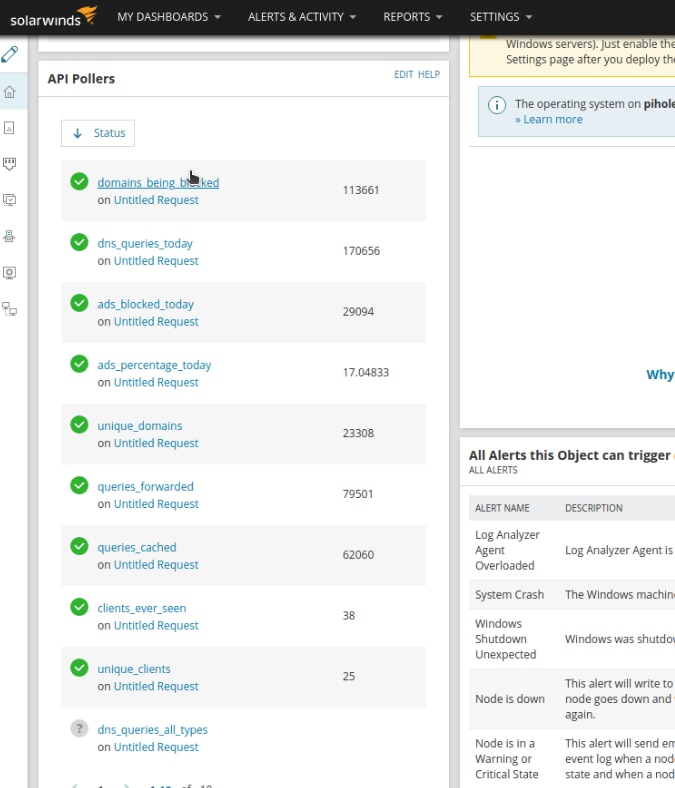
I’m serious, it’s this easy. I’m not saying coding API monitors with PowerShell wasn’t a wonderful learning experience, and I’m sure down the road I’ll use the techniques I learned.
But when you have several APIs, with a bunch of values each, this process is significantly easier to set up and maintain.
Kudos once again to
@kmsigma for the PowerShell support; and
@serena and her team for all their hard work and support making our lives as monitoring engineers better every day.
Try it out yourself and let us know your experiences in the comments below!
 That’s the data we want to collect using the new Orion API monitoring function.
The API Poller – A Step-by-Step Guide
To start off, make sure you’re monitoring the Raspberry Pi in question at all, so there’s a place to display this data. What’s different from the SAM Component version is you can monitor it using the ARM agent, or SNMP, or even as a ping-only node.
Next, on the Node Details page for the Pi, look in the “Management” block and you should see an option for “API Poller.” Click that, then click “Create,” and you’re on your way.
 You want to give this poller a name, or else you won’t be able to include these statistics in PerfStack (Performance Analyzer) later. You can also give it a description and (if required) the authentication credentials for the API.
 On the next screen, put in the Pi-Hole API URL. As I said before, that’s http://<your pi-hole IP or Name>/admin/api.php. Then click “Send Request” to pull a sample of the available metrics.
 The “Response” area below will populate with items. For the ones you want to monitor, click the little computer screen icon to the right.
 If you want to monitor the value without warning or critical thresholds, click “Save.” Otherwise change the settings as you desire.
 As you do, you’ll see the “Values to Monitor” list on the right column populate. Of course, you can go back and edit or remove those items later. Because nobody’s perfect.
 Once you’re done, click “Save” at the bottom of the screen. Scroll down on the Node Details page and you’ll notice a new “API Pollers” Section is now populated.
 I’m serious, it’s this easy. I’m not saying coding API monitors with PowerShell wasn’t a wonderful learning experience, and I’m sure down the road I’ll use the techniques I learned.
But when you have several APIs, with a bunch of values each, this process is significantly easier to set up and maintain.
Kudos once again to @kmsigma for the PowerShell support; and @serena and her team for all their hard work and support making our lives as monitoring engineers better every day.
Try it out yourself and let us know your experiences in the comments below!


