Problems
Monitoring tools are needed because computers fail, and when they do, organizations lose money. Analysis tools are needed because humans can’t handle the sheer volume of information coming back from monitoring tools, even in small businesses. At enterprise scale, attempting to make sense of raw monitoring data is simply impossible. Today’s business applications rarely run on a single computer, further complicating matters. A relatively simple point-of-sale application operating today may, for example, have a client component running on various endpoints, a connection to an on-premises accounting package, and a public cloud-hosted e-commerce suite. In addition to all this is usually an order/process tracking system and/or an inventory management system as well as integration with various suppliers, logistics companies, customers’ IT systems, and more. This is what a point-of-sale system looks like for a small business these days; for large enterprises, they can be far more complex. A single application can have an incomprehensible number of potential points of failure. Fortunately, computers are good at helping us take care of them.Resolving Problems
Computers are instrumented. They provide various performance counters, error logs, and more. And if you configure everything correctly, all this information can be collected, stuffed into a database, and analyzed for correlations. Machine learning also can be used to analyze the data, enabling the analysis packages to offer suggestions regarding problem resolution. Performance and error data can be lined up to create timelines offering detailed performance histories of multiple application components and the physical infrastructure upon which they rely. By presenting this information visually, these tools empower IT teams to rapidly resolve problems that would have otherwise taken hours or even days of plowing through logs to identify.
Figure 1: Visualization for a SQL Server database query response wait time
For example, Figure 1 displays query response wait time inside a SQL Server database. In this visualization, bigger bars represent total wait time across all executions for the time period (in this view, each day is represented). This view allows the user to see patterns and outliers they might otherwise miss if they were to examine the raw data alone. Like computers, humans are experts at pattern matching and correlation. Unlike computers, our specialty lies not in sifting through numbers but in finding patterns in what we see. The visual cortex makes up 30% of the human brain, and if a computer can represent information visually, humans can still find the root cause of a problem faster than a computer. This is in part because we can look at the visual representation of performance information for physical and virtual computers, applications, and networks; rapidly identify patterns; and use our knowledge and experience to narrow our focus. In other words, building visualizations makes communicating information simpler, especially with individuals or teams who may not have the technical depth required to draw accurate conclusions from non-visually represented data.Resolving Database Problems
Not everything requires a human’s pattern recognition, however, and this is where the details of what you’re trying to analyze starts to matter. A database performance problem could be caused by the complex interaction of multiple infrastructure components, or someone may have just written a single problematic SQL query. Here, computers will find the problem much faster than we can.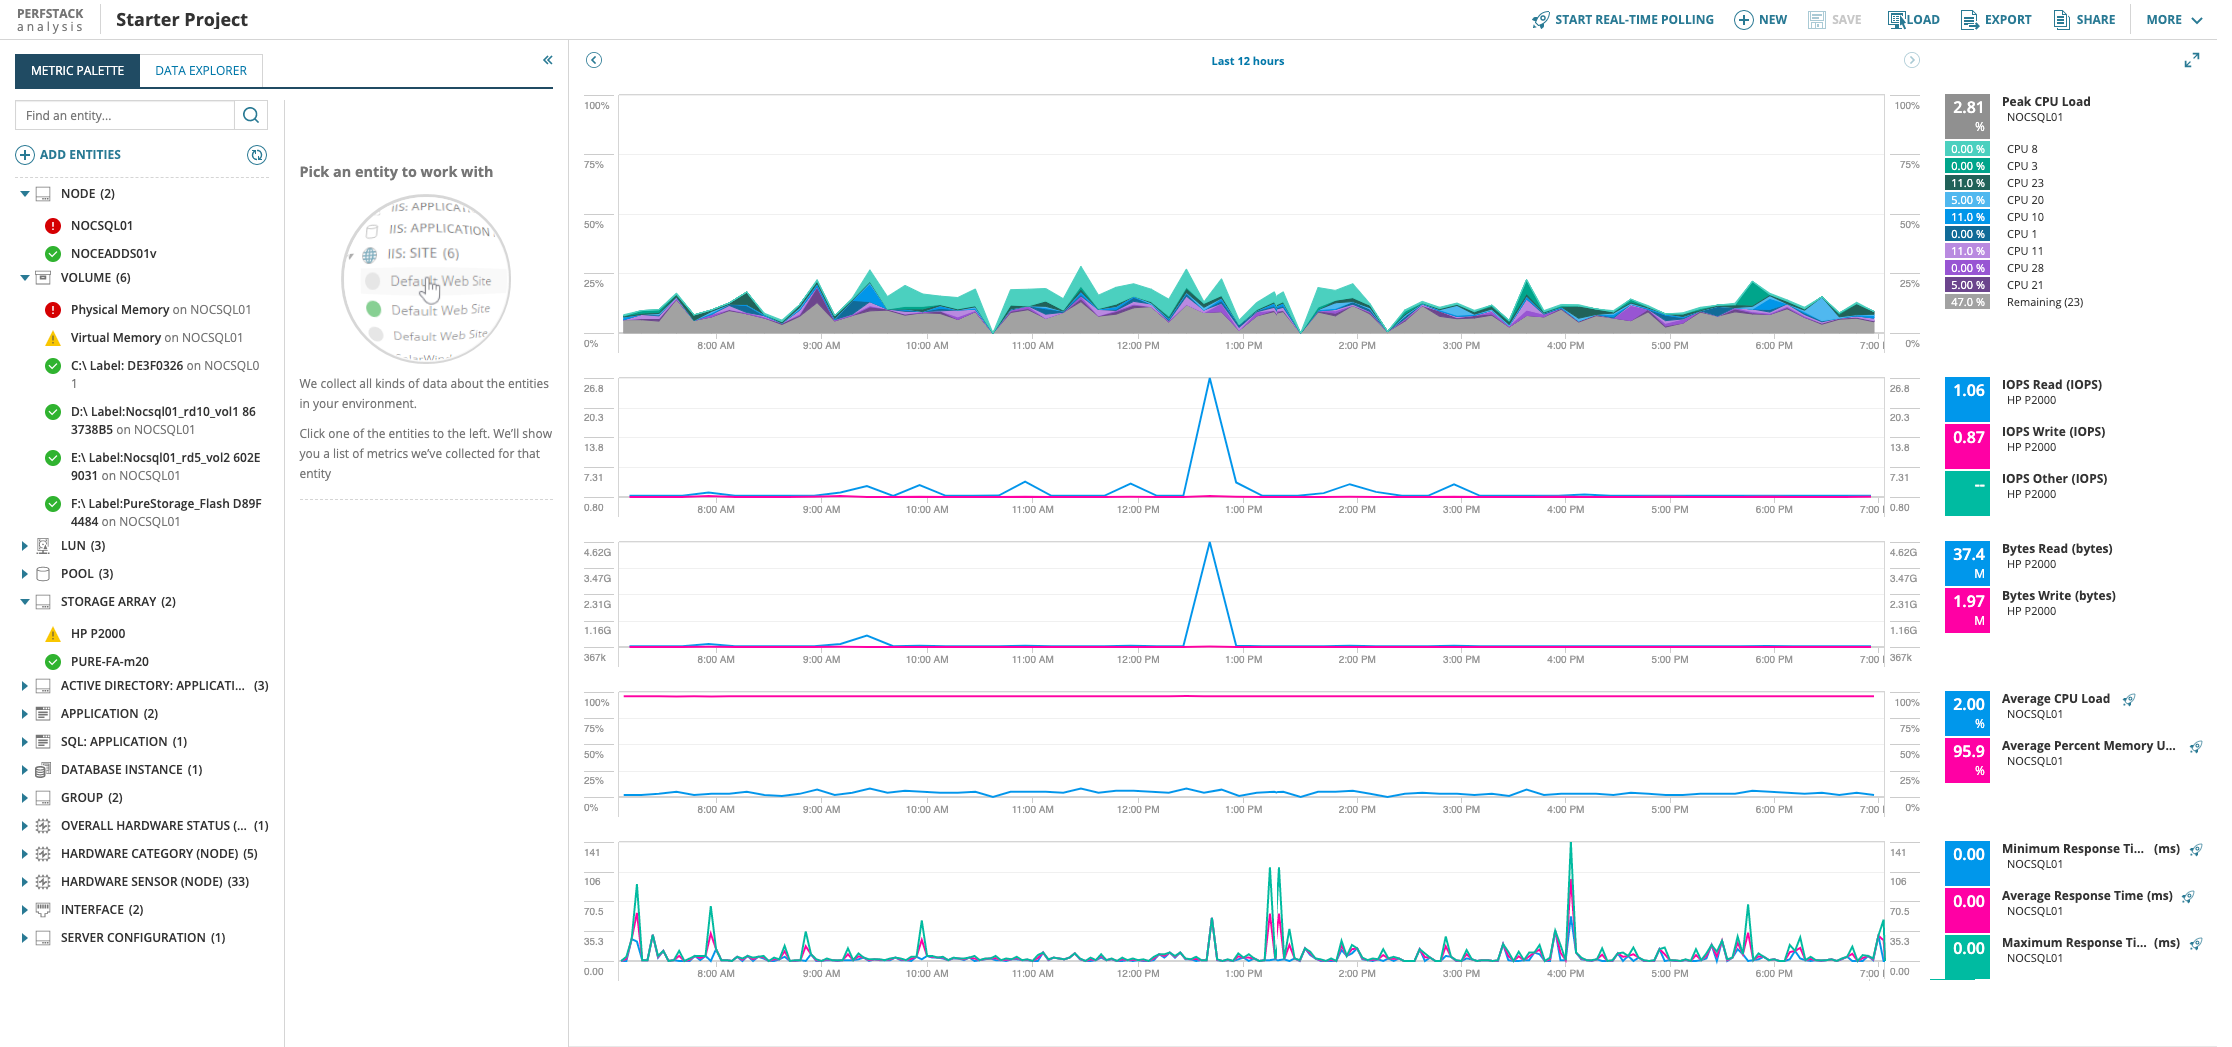
Figure 2: SolarWinds® Database Performance Analyzer integrating with the SolarWinds Orion® Platform to create a visualization with PerfStack™
Similarly, problems can be caused by database maintenance issues—such as individual database tables needing repair—or optimization issues. Database design can also play a role: which fields are indexed, and which aren’t? How are relationships between fields in different tables handled? Are blocking requests causing problems? These details are often buried in the data. They rarely stand out prominently during a visual inspection in the same way as infrastructure-related performance issues. So what’s the best way to solve database performance problems? Using both the computers and the humans where they work best. If the computer can isolate the problem on its own, great! An analytics application handling root cause analysis on its own is freeing humans up to do more valuable things. If the cause can’t be automatically identified, representing the information visually makes it easy for humans to figure out when the problems occurred and narrow down the likely cause. They can then use the analytics application to dive into the telemetry surrounding the point in time to understand exactly what was going on and why it might be a problem. Figure 2 shows an example of a visualization representing a stacked chart, giving insight into the infrastructure layers contributing to database performance and eventually the end-user experience.