Uptime Metrics Don’t Always Tell the Whole Story
An uptime measurement is typically calculated by dividing the amount of actual, measured uptime against the total uptime possible for a given interval. By this approach, 99.99% uptime translates into about five minutes of downtime in a month (31 days * 24 hours * 60 minutes = 44,640; 44,635/66,640 = 0.99989). By most reckonings, four nines (0.9999) uptime is a good outcome. However, those few minutes of downtime can be trivial or significant depending on when they occur. If they happen between 2 a.m. and 3 a.m. for a domestic online retail outlet, it’s of little importance. If they happen during prime time, right near month’s end, just before the books close, it could be more significant. If they happen just before the holidays during peak shopping season, the opportunity cost could be tens to hundreds of thousands of dollars for every minute. This points to the vital importance of context in making sense of metrics. On its face, 99.99% is smile-worthy. Still, if the 0.1% of downtime occurs in tandem with the top 0.1% of application peak usage, it could be tragic. In this case, 99.99% uptime paints an overly positive picture and may stymie investigation into the root causes of possible performance problems or improper workload allocations. It also raises a serious question: namely, is the failure during times of absolute peak usage a sign the application is under-resourced, poorly positioned, or just an unfortunate coincidence? Failures during peak loads not only have cost consequences from opportunity losses, they also mean metrics relating to reliability, availability, network performance and capacity, and so on must all be examined carefully to see if tweaking or tuning is needed.Teasing Out Hidden Costs
Organizations should also measure the use of automation against typical service and trouble ticket resolution times. Ideally, the more automation is used, the less time it should take to resolve open tickets. This is why it’s helpful for IT organizations to monitor mean time to resolution (MTTR) for service and trouble tickets as well as how much (and how well) they’re making use of automation in their configuration, provisioning, maintenance, and troubleshooting workflows. This can also provide a useful meta-metric for establishing and tracking the value of automation within an organization. Clearly, it’s not just a case of “more is better” when it comes to automation. Instead, it’s “more is much better” when automation speeds resolution of the most common service requests and troubleshooting tasks. Another such inverse correlation applies to self-service portals, incidents, and service requests. Ideally, the more end users find the self-service portal meets their needs for data sets, analyses, access to services and resources, etc., the lower the frequency of service requests to IT should become. This is not just a matter of shortening MTTR. It’s also about using self-service portals to let users meet common service requests without requiring a service ticket to be generated, tracked, handled, and ultimately closed. When implemented and maintained properly—with options for users to request changes, additions, and enhancements to self-service portals and capabilities—this should result in fewer service tickets generated and should produce happier and more productive end users.The Metrics Story Needs Assessment and Understanding
Complex, hybrid cloud-based environments too often suffer from a surfeit of management tools and utilities. Companies often benefit from narrowing their options down to one consistent and coherent end-to-end management platform. By making such a switch, they typically reduce the number of management tools used by a factor of three while simplifying and speeding up the management of their IT operations. This produces the kind of “virtuous cycle” shown in Figure 1, which takes advantage of heightened visibility and automation to add opportunities for ongoing optimization and improved metrics by which to measure the IT infrastructure’s overall health.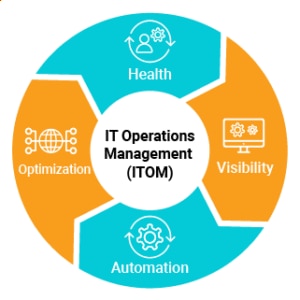
Figure 1: IT operations management helps organizations optimize their infrastructure through visibility and automation
Establishing useful cost metrics—above and beyond the cost of IT acquisitions, amortization, and depreciation (on the CapEx side), together with the cost of IT consumption, including software as a service (SaaS) solutions, cloud resources, usage, and permanent virtual machine allocations (on the OpEx side)—will reveal the areas benefitting most from automation and self-service access. Thus, it’ll also find targets for relentless, ongoing optimization and improvements to keep driving costs in the right direction. Cost monitoring involves tracking how IT is spending its time and using its capabilities as well as tracking actual, out-of-pocket acquisitions and outlays. From recurring billings for cloud services and making good use of automation to asset and software license management, learn how enterprises can gain end-to-end IT operations visibility across their on-premises and cloud instances with SolarWinds Observability Self-Hosted (formerly known as Hybrid Cloud Observability). With flexible, node-based licensing, SolarWinds Observability Self-Hosted (formerly known as Hybrid Cloud Observability) offers total cost of ownership advantages through a comprehensive full-stack solution.