Parsing Is the First Step
After you’ve completed a successful connection to a database server and typed your query, the first step in getting your results is called parsing. When you or your application submits a query to the database engine, the engine first reviews your SQL statement to ensure the syntax is valid. For example, if you type ELECT Column1 FROM Table1 (my own most frequent SQL typo), the engine will quickly give you an error. Next, the parser ensures Table1 is a valid table by examining the data dictionary (a system managed data structure designed to store metadata about the database) and column1 is a valid column. Once the query is validated, the interesting part starts to happen.Execution and Explain Plans
If you talk to any performance-tuning expert, you’ll learn the most important factor in improving database performance is understanding how execution or explain plans work. These plans (the name is dependent on the database engine, but the terms are interchangeable) are generated after the query is parsed—they determine the set of operations required to retrieve the results of the query from memory or the storage subsytem. In some database engines (SQL Server and Oracle), after execution plans are generated they are cached in memory for reuse. The query engine then applies various costing algorithms, such as index statistics and histogram distributions, to quickly generate an optimal plan. Plan generation is expensive from a CPU perspective, so the database engine will generate several plans and then choose the lowest cost option. Depending on your database engine, there are different ways to capture these plans—this is an important step in tuning the performance of a query, so you can discover if and where potential bottlenecks exist. Learning to read execution plans is an important skill for a DBA, and if you aren’t a DBA, there are tools to help you understand problematic execution plans.Influencing an Execution Plan
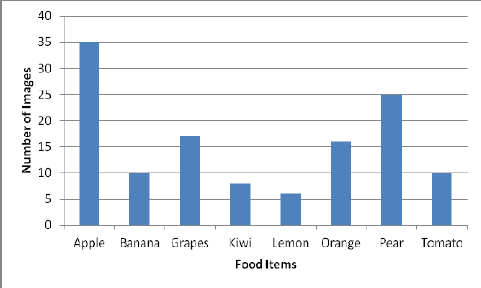
The two ways you can change an execution plan without changing code is by changing column statistics or adding or removing an index. The column and index statistics I briefly touched on above play a critical role in query performance. Query optimizers use them to define the cardinality, or the number of rows in the query result. Statistics are typically stored as histograms showing the statistical distribution of data in the column. Each database engine does this slightly differently, but the end result will be similar to what’s shown in Figure 1.
Figure 1: Example of a histogram
Depending on the number of values, the query optimizer may choose to scan an entire column, or retrieve the specific rows to answer a query result. While retrieving specific rows (typically called a seek) is a cheaper operation, there are times (for example, finding the average of all invoices) scanning the entire column is the better operation—and only having good query statistics allows the optimizer to choose the lowest cost. You’ll need to understand how your database updates statistics, as some database engines do this automatically, but some sets of data may require you update them more frequently than the system-generated statistics. You can also influence execution plans by adding or removing indexes. Indexes represent one or more columns stored separately from a table. Much like your favorite music app sorts your music by lots of attributes for finding your favorites quickly (such as genre, artist name, date added to the app, etc.), an index allows the database engine to perform lookups without reading the entire table. This reduces the amount of I/O needed to execute a query, and can dramatically increase the performance of your database. Choosing the proper indexes on database tables represents some of the biggest potential performance gains in all of IT. Some database engines recommend indexes for you, while others may require you to inspect execution plans to analyze indexes. For non-database administrators, this is an area where you’ll likely benefit from database-specific tooling.


