Database performance is critical to business revenue. Slow and non-responsive databases can result in hundreds of thousands or millions of dollars in lost revenue from poor customer experience and downtime. High expectations in performance require IT infrastructure to function at full speed.
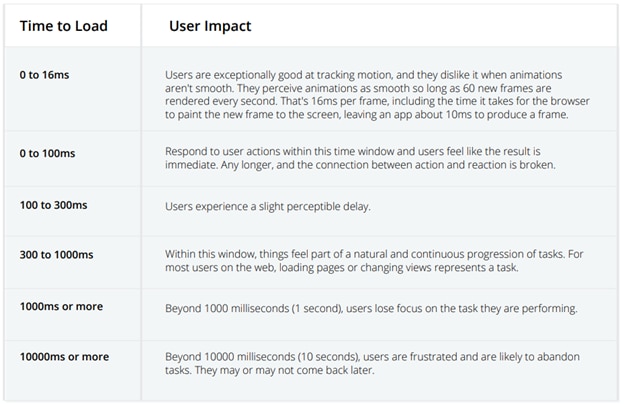
In 2006, an Amazon study found that every 100ms in added page load time cost them 1% in sales. The lost revenue at that time would have been around $107 million; today, the financial hit would total closer to $4 billion.
Similarly, a Google study showed that a 500 ms increase in search display time reduced revenue by 20 percent*. Their full findings are shown in this table.
 Speed Impact study “Microseconds make millions”**
“
Results showed that a mere 0.1s change in load time can influence every step of the user journey, ultimately increasing conversion rates. Conversions grew by 8% for retail sites and by 10% for Travel sites on average.”
Google/55/Deloitte, EMEA and U.S., Speed Impact study, Oct. 2019–Nov. 2019
More recently, in the
PageSpeed Impact study from Google notes, data show that fast response times are crucially important for the entire customer journey, affecting user experience and revenue.
In trying to identify the cause of a performance issue, most of the time is spent determining which queries are at fault and where they came. Typically, the amount of time fixing the problem is a small percentage of the overall troubleshooting effort. With large web applications such as the Shopify platform with builds of millions of lines of code*** and managed by hundreds of engineers, finding which deploy introduced the code and who is responsible for maintaining that code is a sizeable portion of the time spent to repair.
To pinpoint which queries have been subject to change, we can look at changes in the workload compared to normal operation. This screenshot shows the Compare feature used in the
SolarWinds® Database Performance Monitor Profiler to bubble up the groups of queries that have changed most over the past hour.

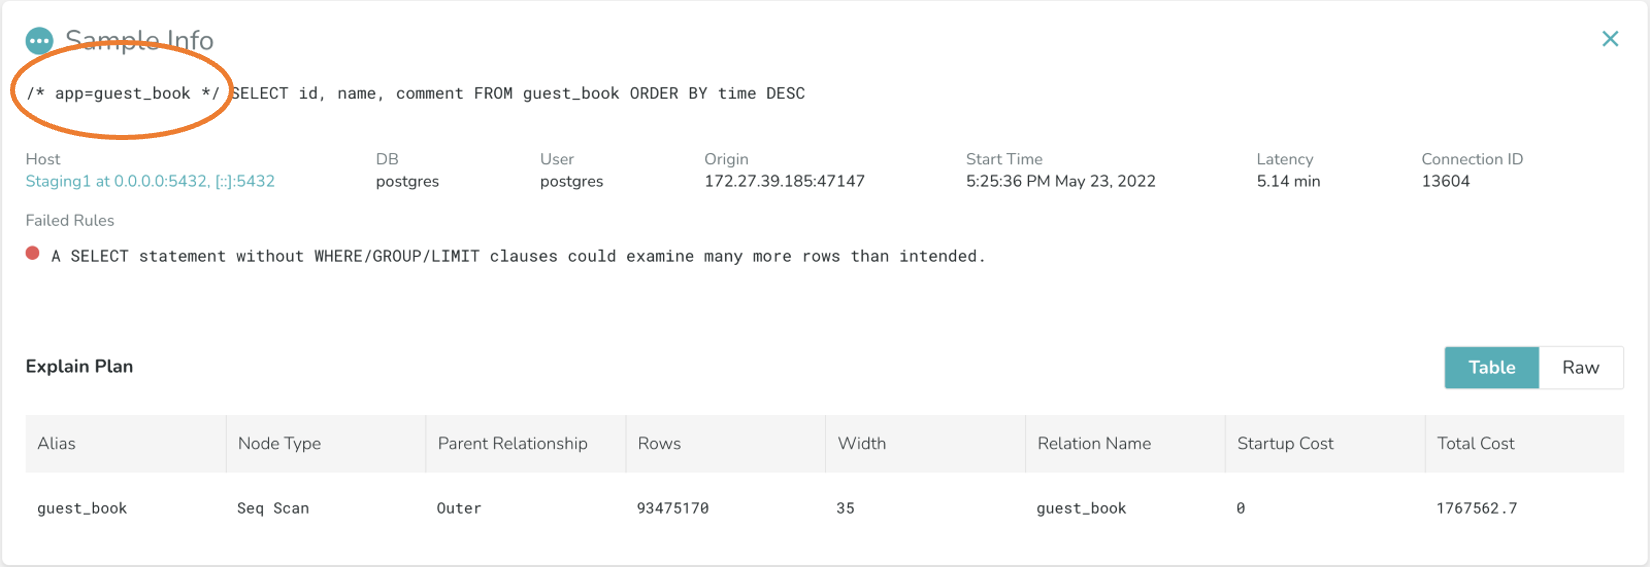
The challenge now becomes where this query came from, a question DPM Profiler can also assist in solving. In addition to visualizing meta data such as User, Schema, and origin data, it also supports the display of query comments, which can communicate additional information about the query.

Given the size and complexity of today's applications, manually annotating queries may not be feasible, and this is where solutions such as the
Marginalia gem, created by 37signals, can really help to reduce the level of confusion.
Marginalia ships with :application, :controller, and :action enabled by default. In addition, implementation is provided for:
- :line (for file and line number calling query). :line supports a configuration by setting a regexp in Marginalia::Comment.lines_to_ignore to exclude parts of the stacktrace from inclusion in the line comment.
- :controller_with_namespace to include the full classname (including namespace) of the controller.
- :job to include the classname of the ActiveJob being performed.
- :hostname to include Socket.gethostname.
- :pid to include current process id.
- :db_host to include the configured database hostname.
- :socket to include the configured database socket.
- :database to include the configured database name.
To install, simply include it in your Gemfile.
--
# Gemfile
gem 'marginalia'
--
This powerful Gem can automatically prepend or append comments which indicate where in the application a particular query originated.

SELECT `accounts`.* FROM `accounts` WHERE `accounts`.`queenbee_id` = 1234567890 LIMIT 1 /*application:BCX,controller:project_imports,action:show*/

This means queries can carry the Origin data such as the application, controller and function, which is calling or generating the query, right down to the line of code and author of the call. At this point,
within a few clicks we have both the problematic queries, the code responsible for those queries and the author of the code itself.
In some cases, we may need to perform more work to boil down the candidate queries to the ones most relevant to the case in hand. Here too, SolarWinds DPM can help and has the facility to parse comments included with a query which contains key-value pairs and convert those into tags to associate with query digests.
This means we can use those same tags generated from the Marginalia comment filter information in the Profiler, meaning we can see the change in queries for a specific Application, Controller and View.

During diagnosis we can also use the key value pairs from the comments to understand which applications, controllers and views may be affected, by grouping by tag.

Identifiers in the form of key value pairs embedded in comments such as those provided by Marginalia reduce the total amount of data to be reviewed and can indicate the source code and developer responsible for the query.
As illustrated by the functionality examples and screenshots, using SolarWinds DPM and Marginalia together enables teams using Rails to
perform root cause analysis more efficiently, fix database problems more rapidly, and support service level agreements to ensure the consistent optimal customer experience.
*http://robotics.stanford.edu/people/ronnyk/2007IEEEComputerOnlineExperiments.pdf
**Google/55/Deloitte, EMEA and U.S., Speed Impact study, Oct. 2019–Nov. 2019
*** https://shopify.engineering/shopify-monolith
**** https://signalvnoise.com/posts/3130-tech-note-mysql-query-comments-in-rails  Speed Impact study “Microseconds make millions”**
“Results showed that a mere 0.1s change in load time can influence every step of the user journey, ultimately increasing conversion rates. Conversions grew by 8% for retail sites and by 10% for Travel sites on average.”
Google/55/Deloitte, EMEA and U.S., Speed Impact study, Oct. 2019–Nov. 2019
More recently, in the PageSpeed Impact study from Google notes, data show that fast response times are crucially important for the entire customer journey, affecting user experience and revenue.
In trying to identify the cause of a performance issue, most of the time is spent determining which queries are at fault and where they came. Typically, the amount of time fixing the problem is a small percentage of the overall troubleshooting effort. With large web applications such as the Shopify platform with builds of millions of lines of code*** and managed by hundreds of engineers, finding which deploy introduced the code and who is responsible for maintaining that code is a sizeable portion of the time spent to repair.
To pinpoint which queries have been subject to change, we can look at changes in the workload compared to normal operation. This screenshot shows the Compare feature used in the SolarWinds® Database Performance Monitor Profiler to bubble up the groups of queries that have changed most over the past hour.
 The challenge now becomes where this query came from, a question DPM Profiler can also assist in solving. In addition to visualizing meta data such as User, Schema, and origin data, it also supports the display of query comments, which can communicate additional information about the query.
 Given the size and complexity of today's applications, manually annotating queries may not be feasible, and this is where solutions such as the Marginalia gem, created by 37signals, can really help to reduce the level of confusion.
Marginalia ships with :application, :controller, and :action enabled by default. In addition, implementation is provided for:

 This means queries can carry the Origin data such as the application, controller and function, which is calling or generating the query, right down to the line of code and author of the call. At this point, within a few clicks we have both the problematic queries, the code responsible for those queries and the author of the code itself.
In some cases, we may need to perform more work to boil down the candidate queries to the ones most relevant to the case in hand. Here too, SolarWinds DPM can help and has the facility to parse comments included with a query which contains key-value pairs and convert those into tags to associate with query digests.
This means we can use those same tags generated from the Marginalia comment filter information in the Profiler, meaning we can see the change in queries for a specific Application, Controller and View.
 During diagnosis we can also use the key value pairs from the comments to understand which applications, controllers and views may be affected, by grouping by tag.
 Identifiers in the form of key value pairs embedded in comments such as those provided by Marginalia reduce the total amount of data to be reviewed and can indicate the source code and developer responsible for the query.
As illustrated by the functionality examples and screenshots, using SolarWinds DPM and Marginalia together enables teams using Rails to perform root cause analysis more efficiently, fix database problems more rapidly, and support service level agreements to ensure the consistent optimal customer experience.
*http://robotics.stanford.edu/people/ronnyk/2007IEEEComputerOnlineExperiments.pdf
**Google/55/Deloitte, EMEA and U.S., Speed Impact study, Oct. 2019–Nov. 2019
*** https://shopify.engineering/shopify-monolith
**** https://signalvnoise.com/posts/3130-tech-note-mysql-query-comments-in-rails


