Talk to someone who runs monitoring systems at a company with more than a few servers and you’ll quickly find out that scaling their monitoring systems is far from a minor concern. It’s often a serious problem. The three primary costs of self-hosting an open-source monitoring system, according to our survey of hundreds of Operations staff at large companies, are:
- Hardware. Systems like Graphite, Ganglia, RRDTool, and Zabbix are notoriously hardware-hungry. They end up requiring high-end hardware, typically with expensive SSD storage. Anecdotally, many medium-sized companies I know (a few hundred servers) are running large Graphite clusters pretty hot. The alternative to spending freely on hardware is suffering through monitoring systems that are unusably slow.
- Installation and Maintenance. It takes a surprisingly long time to install and configure these open-source systems. I vividly remember the first time I set up Nagios. It is a memory that thousands of sysadmins share with me. We should start a support group. But that’s only the start, because, incredibly, these systems take a lot of babysitting. Integration, customization, upgrades, and other ongoing concerns eat huge amounts of time.
- Lack of Return On Investment. Over and over, our customers have told us that after all the work and expense of setting up monitoring systems, they remain frustrated with the almost complete lack of results. There are several reasons for this, but it stems from the fact that these systems are least-common-denominator, pulling generic metrics that the systems in question happen to have accessible (instead of measuring what matters), and displaying it in a one-size-fits-all dashboard, predominantly time-series charts. Tens of thousands of time-series charts do not help in an emergency, they make the problem worse.
If Developers Can’t Self-Service, Everyone Suffers
Monitoring (we like to say performance management, but that’s an aside) is emphatically not a tool for operations. The reality is that developers outnumber operations and DBA staff by a factor of 10:1 or greater in most organizations. If developers have to ask the gatekeepers for help inspecting the systems in production, it creates a vicious pinch point that slows the entire organization.
We all know that the operations staff are typically stressed out, interrupted, and crisis-driven. It’s not by choice! They don’t like it any more than the developers do. It’s just that monitoring tools don’t provide visibility into production systems in a meaningful way.
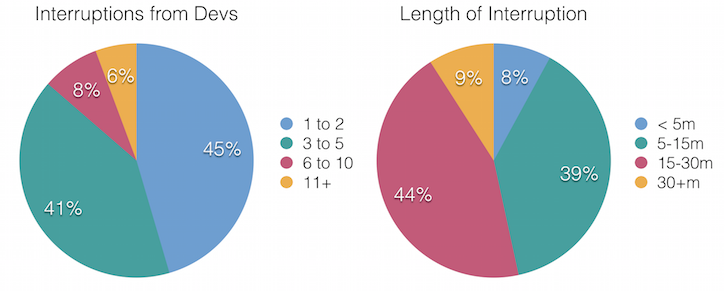
The result is incredibly distracted operations staff. Here’s what our survey found: Developers interrupt Operations/DBA staff, on average,
54 minutes per day, causing IT productivity to plummet.

There’s a lot to unpack in those results, but think about it this way:
more than half of these people are getting 3 or more interruptions per day, and more than half of those interruptions last longer than 15 minutes. The first number is actually the more concerning. A few interruptions a day and productivity is shot.
The burdened salary cost alone is stunning: $22,000 per year per DBA,
not counting the ripple-effects, such as developer time spent waiting for DBAs to complete the blocking request, delayed IT objectives, and so on. To get a true picture of the real cost, you probably have to multiply the DBA’s time by a factor of at least 10.
Maintaining Open-Source and Homegrown Monitoring Tools Costs Big
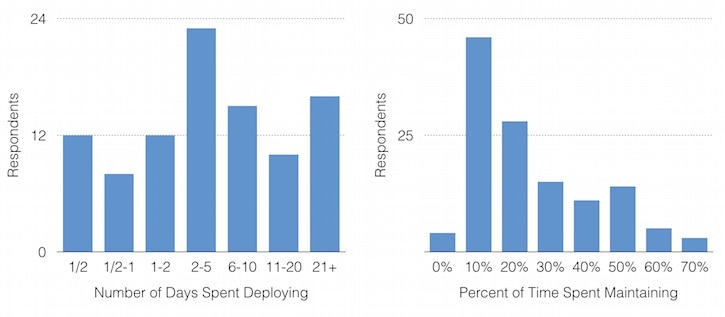
What are the DBA and operations staff doing when they’re not being interrupted by developers? There’s a decent chance they’re trying to fix or improve the monitoring tools! Take a look at what our survey respondents had to say about the effort involved in “free” open-source monitoring tools.

The first chart says that open-source and in-house monitoring tools are slow to deploy, and the second one says it takes a lot of maintenance time. In a nutshell, a DiY system
typically takes a week or longer to deploy, and an average of 30% of your time to maintain. Again, that’s a burdened $60,000 per operations staff per year.
Free Like A Puppy? There’s A Better Way
By now it should be clear why I often say open-source software is free in the same way that a puppy is free. It’s only free if you don’t value your time (and hardware, and site availability, and staff’s job satisfaction, and…) By some estimates we heard from our customers, a small to medium-sized IT-heavy company can easily spend several million dollars a year in monitoring. That’s a staggering amount, especially when you consider what they’re getting in return.
I haven’t gone into the costs and benefits of
SolarWinds Database Performance Monitor (DPM), but clearly our customers are seeing the value. Unlike open-source monitoring software,
- DPM is extremely fast and easy (15 seconds) to install and maintain, light on system resources, and secure.
- DPM is SaaS-hosted, so it’s all-inclusive. The sticker price is the whole price.
- DPM measures an incredible amount of detail about your systems, in 1-second resolution – something you wouldn’t dream of doing with Graphite or similar.
- DPM measures what matters: the work your system does! We don’t just capture metrics your systems happen to expose, we get the telemetry you need to find, solve, and prevent problems.
- DPM scales and performs well on large numbers of servers.
There’s no better way to find out than to sign up for a
free trial today!  There’s a lot to unpack in those results, but think about it this way: more than half of these people are getting 3 or more interruptions per day, and more than half of those interruptions last longer than 15 minutes. The first number is actually the more concerning. A few interruptions a day and productivity is shot.
The burdened salary cost alone is stunning: $22,000 per year per DBA, not counting the ripple-effects, such as developer time spent waiting for DBAs to complete the blocking request, delayed IT objectives, and so on. To get a true picture of the real cost, you probably have to multiply the DBA’s time by a factor of at least 10.
 The first chart says that open-source and in-house monitoring tools are slow to deploy, and the second one says it takes a lot of maintenance time. In a nutshell, a DiY system typically takes a week or longer to deploy, and an average of 30% of your time to maintain. Again, that’s a burdened $60,000 per operations staff per year.


