 You’ll notice that we focus on data that traditional monitoring systems don’t even measure: query and process behavior. These represent the fundamental things you want to measure about systems and services: work being done. From this overview you can quickly drill into any portion of the app you wish: query behavior, process behavior, charts and graphs, events, and more.
This is only the beginning. Our motto is “release early, release often” and this by no means represents a finished product. Stay tuned (and keep the suggestions coming) as we continue to build a product that focuses on insight, not just an ocean of metrics.
If you’re not yet a SolarWinds DPM customer, find out why people are switching from other monitoring systems in droves: start your free trial today
You’ll notice that we focus on data that traditional monitoring systems don’t even measure: query and process behavior. These represent the fundamental things you want to measure about systems and services: work being done. From this overview you can quickly drill into any portion of the app you wish: query behavior, process behavior, charts and graphs, events, and more.
This is only the beginning. Our motto is “release early, release often” and this by no means represents a finished product. Stay tuned (and keep the suggestions coming) as we continue to build a product that focuses on insight, not just an ocean of metrics.
If you’re not yet a SolarWinds DPM customer, find out why people are switching from other monitoring systems in droves: start your free trial today Introducing SolarWinds Database Performance Monitor's New Summary Dashboard
July 16, 2015 |
Database
I’m happy to announce that we’ve released a new default dashboard for SolarWinds® Database Performance Monitor (DPM).
Why a new dashboard? Simple: reduce the time-to-insight as far as possible. We capture and analyze an incredible amount of data, but it can be overwhelming for a person, especially someone new to SolarWinds DPM, to make sense of it. We want our customers to be able to instantly see and understand what’s happening in their data tier.
That’s the feedback our customers gave us, and we listened carefully. The new dashboard is the result of many customer conversations and the guidance of our Customer Advisory Board.
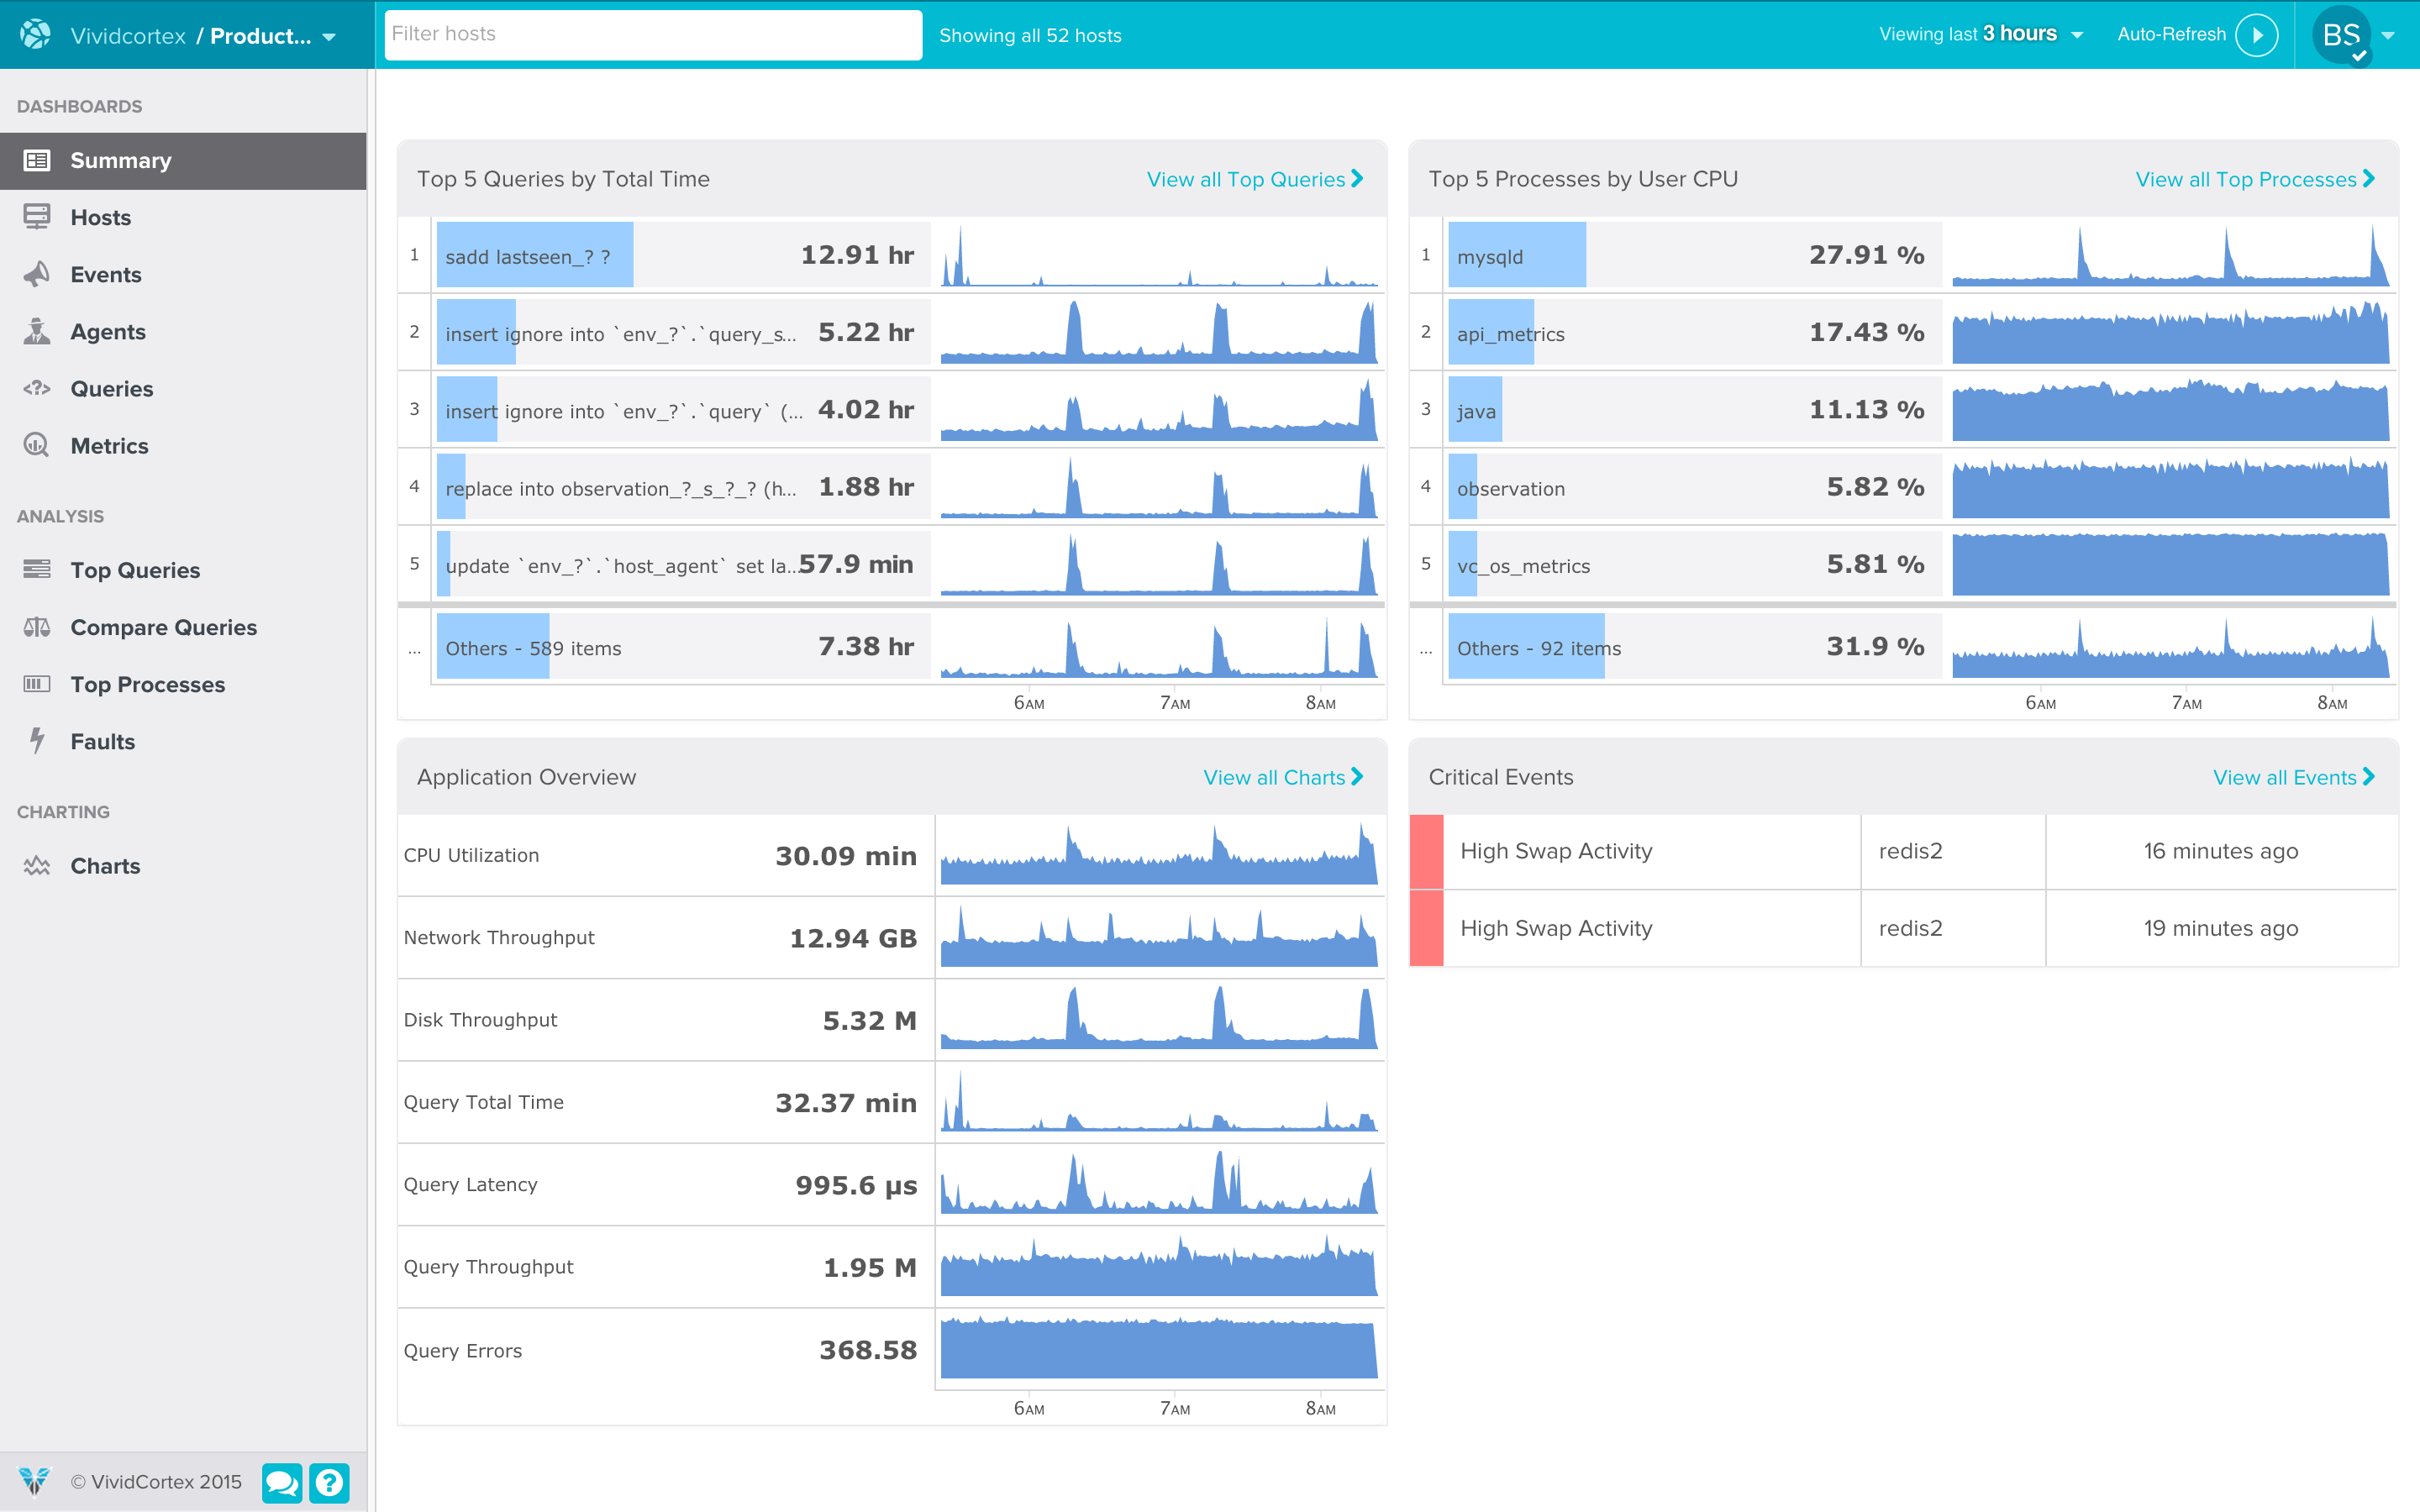
Here’s a screenshot.
You’ll notice that we focus on data that traditional monitoring systems don’t even measure: query and process behavior. These represent the fundamental things you want to measure about systems and services: work being done. From this overview you can quickly drill into any portion of the app you wish: query behavior, process behavior, charts and graphs, events, and more.
This is only the beginning. Our motto is “release early, release often” and this by no means represents a finished product. Stay tuned (and keep the suggestions coming) as we continue to build a product that focuses on insight, not just an ocean of metrics.
If you’re not yet a SolarWinds DPM customer, find out why people are switching from other monitoring systems in droves: start your free trial today
You’ll notice that we focus on data that traditional monitoring systems don’t even measure: query and process behavior. These represent the fundamental things you want to measure about systems and services: work being done. From this overview you can quickly drill into any portion of the app you wish: query behavior, process behavior, charts and graphs, events, and more.
This is only the beginning. Our motto is “release early, release often” and this by no means represents a finished product. Stay tuned (and keep the suggestions coming) as we continue to build a product that focuses on insight, not just an ocean of metrics.
If you’re not yet a SolarWinds DPM customer, find out why people are switching from other monitoring systems in droves: start your free trial today