This post is part of an ongoing series on the best practices for effective and insightful database monitoring. Much of what's covered in these posts is not intuitive, yet vital to understand. Previous posts have covered Why Percentiles Don't Work the Way You Think; how to avoid getting to a point When It's Too Late to Monitor; an explanation of why, when looking at charts, you should understand that A Trendline is a Model; and Why You Should Almost Never Alert on Thresholds.
One of the most frequent reactions people have after installing SolarWinds
® Database Performance Monitor (DPM) is "I didn't know my systems were doing
that!" Another way to say this is, new SolarWinds DPM users almost immediately learn something new about their systems.
Learning something new is cool, but how do you know when a query's behavior is not only unexpected, but actually
bad?
Great question. One of the things that happens a lot on production databases is something goes wrong and every query starts performing badly. I like to call this collateral damage. It points to a problem very clearly, but it usually doesn't point to the source of the problem. That's because it's hard to tell victims from perpetrators in this situation.
But having multidimensional query performance data, at a very fine level of granularity, changes everything. Suddenly you can tell the causes and effects apart a lot more easily.
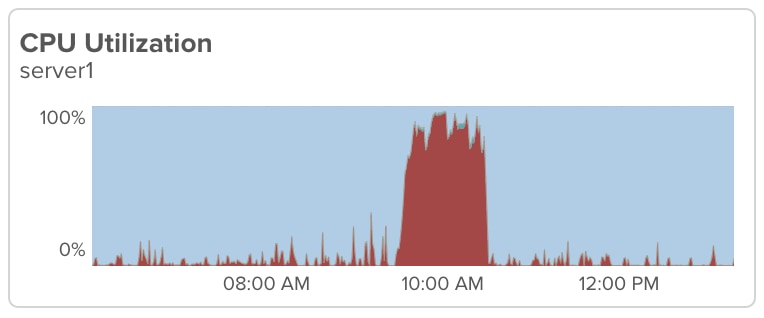
Here's an example I saw recently. There's a query that's running from a scheduled job. It runs intermittently and is a big source of load on the system while it's doing that. You can see the increase in CPU time clearly in the graphs:

The question, though, would be whether it's negatively impacting the system while it runs. Maybe there's enough capacity for this query to run and nothing else is suffering?
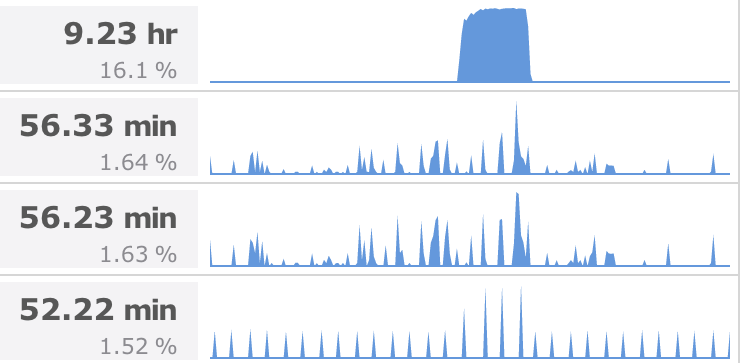
That's where a visualization of query behavior over time is so helpful. Look at this graph of query execution time:

You're probably looking at the graph of the query on top, but look at the fourth one. What happens to it when the first query is running? Its execution time gets much worse, approximately double. The middle two queries are less uniform so it's harder to see, but they suffer too.
Many tools measure only some query behavior (for example, only queries that are executed from app code that's instrumented) and will miss this type of scenario. They'll show you the fourth query getting slow, but you will not see the first query at all, so you'll have no way to explain why.
So yes, this periodic query is actually bad. And that's the power of the per-query, server-centric workload analysis that SolarWinds DPM offers.
 The question, though, would be whether it's negatively impacting the system while it runs. Maybe there's enough capacity for this query to run and nothing else is suffering?
That's where a visualization of query behavior over time is so helpful. Look at this graph of query execution time:
 You're probably looking at the graph of the query on top, but look at the fourth one. What happens to it when the first query is running? Its execution time gets much worse, approximately double. The middle two queries are less uniform so it's harder to see, but they suffer too.
Many tools measure only some query behavior (for example, only queries that are executed from app code that's instrumented) and will miss this type of scenario. They'll show you the fourth query getting slow, but you will not see the first query at all, so you'll have no way to explain why.
So yes, this periodic query is actually bad. And that's the power of the per-query, server-centric workload analysis that SolarWinds DPM offers.


