You probably have known for a while that SolarWinds
® Database Performance Monitor (DPM)
inspects TCP traffic and captures query errors and warnings, so you can find problems in production that you wouldn’t find in staging or development. We’ve enhanced this functionality to help you find those problems more precisely.
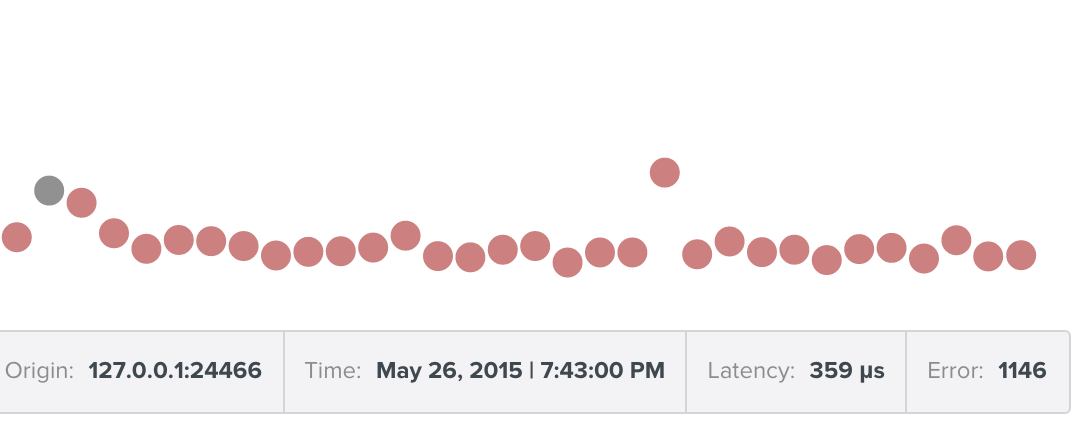
There’s a lot of technical background to this, but the short version is that when you view a scatterplot of query samples, now you’ll see samples highlighted in red if they have errors. Click on one of the samples to see its details as usual. This one has error 1146, which the
perror utility (or a Google search) will quickly tell you is a nonexistent table:
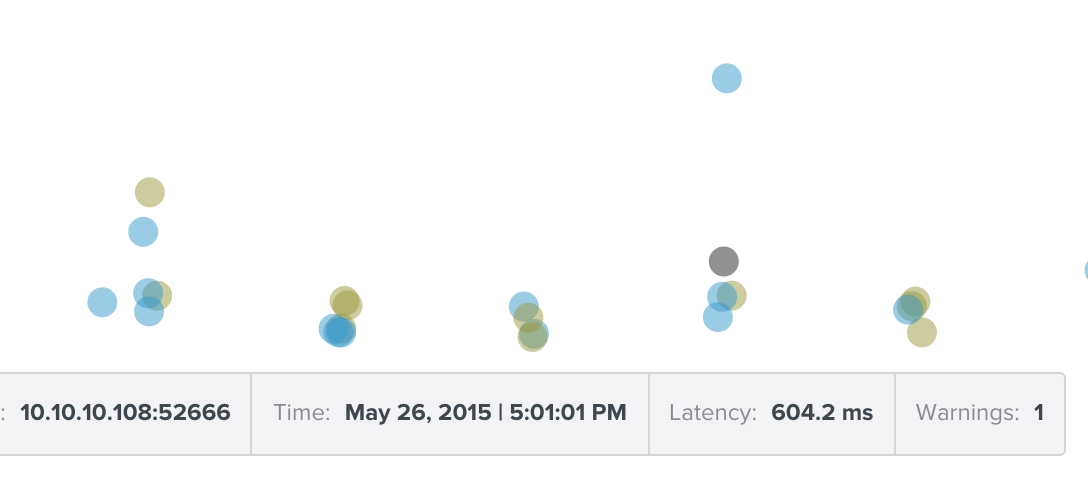
Warnings are highlighted in yellow, and the query’s warning count is now shown as an extra property:
Presto! Enjoy finding exact samples of queries that cause errors and warnings, so you can run them and reproduce the problem.
The technical background to this is that it required a refactor of our query sniffer to do this. We’re hyper-sensitive to any potential inefficiency—any memory being held longer than needed, any delay in processing. This is because TCP reverse-engineering is actually a damn hard challenge, and doing it efficiently and correctly is a major engineering effort. Any delay or similar could potentially cause an edge case, making what’s normally a small delay into a longer delay, which could cause memory to be kept too long, which would cause the agent to use a lot of memory.
As a result of our focus on efficiency, we were sending data about queries between layers of our TCP and protocol reassembly code as soon as we got it, not waiting around for more data to arrive. We refactored this code to let us delay specific bits of the message-passing until more information arrived. This was necessary because the warning count and some other information we wanted to associate with a query sample didn’t arrive until just a bit later in the protocol.
Now, with great care, we have a safe and efficient way to defer sampling a query until we know everything we want to know about it, and that means we can show you the exact error number and warning count in the sample scatter plot.
Enjoy finding bugs and errors in your production code! We have found a bunch of interesting things in our customers’ and their vendors’ code, truly surprising once-in-a-million things as a result of this. That’s the power of production query traffic visibility!