
Why Redis’s TCP Traffic Is Hard To Sniff
The hard part with Redis is correlating the queries (commands) with the responses from the server. This is hard because Redis’s protocol allows pipelining. A client can send many commands without needing to wait for the server to reply to previous commands. When the server does reply, the responses come in the same order as the original commands were sent, but they are not otherwise labeled as belonging to any specific command. The client needs to figure out which response belongs to which command by keeping a FIFO queue of commands it sent. When a response comes back, it belongs to the oldest pending command. This is kind of a nightmare for TCP sniffing. There are at least two obvious cases where we will be unable to figure out the correlation between commands and responses:- We start observing in the middle of a conversation. Commands have been sent but we didn’t see them.
- We don’t see some packets in the conversation. This happens when the packet rate is high and packets are dropped from buffers before libpcap can observe them.
How We Do It
In this environment, how do we observe the Redis protocol and measure command latencies? Best effort and approximation. In more detail: there are some cases that can be handled and others can’t, and some are a gray area:- No pipelining in use. In this case, if we see a command and a response, we subtract the timings and we’ll be correct, more or less.
- We don’t see the pipelining. We might not be able to measure timings for some commands as a result.
- Pipelining in use. We cannot be sure we’ve seen all the requests and responses, so we take a middle road and apply a heuristic that represents our best effort as to which responses go with which commands, and their timings.
Results
As a result, the timings of our Redis queries have some wiggle room. The error is usually skewed towards the short end – if there’s a timing error, we measure queries as being faster than they might have been. However, this imprecision is worlds better than not having any visibility at all into Redis queries and their latencies. And for longer commands (perhaps a big operation over a very large list/set/hash) the latencies will have a smaller fractional error. And that, in the end, is what we really want to find out. There’s an assumption that “Redis is fast, for every operation, all the time.” But what if it isn’t? My entire career has followed this recipe:- Notice an assumption about something unmeasured, that is never noticed or questioned.
- Find a way to see if it’s true or false. Apply that method.
- Unsurprisingly, the assumption will turn out to be false. Every time.
- Rinse and repeat.
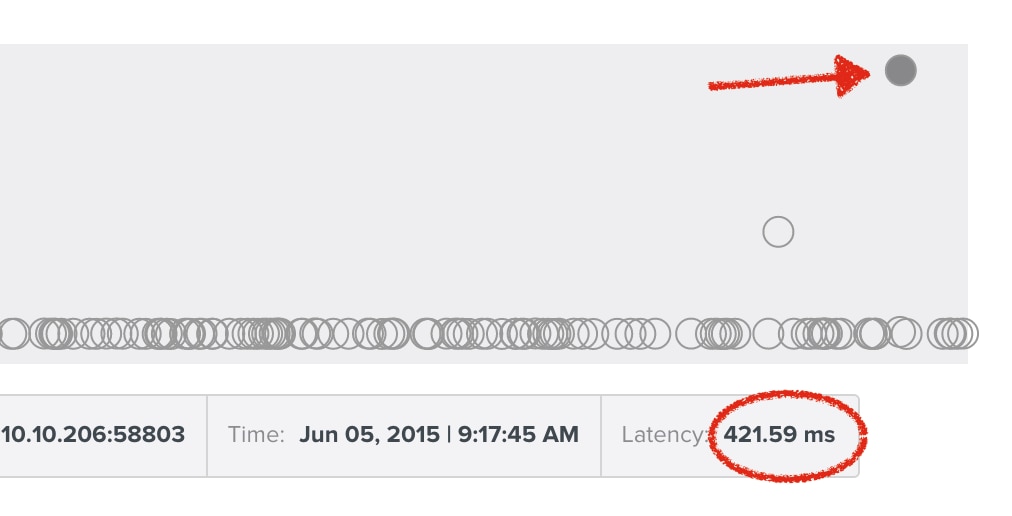
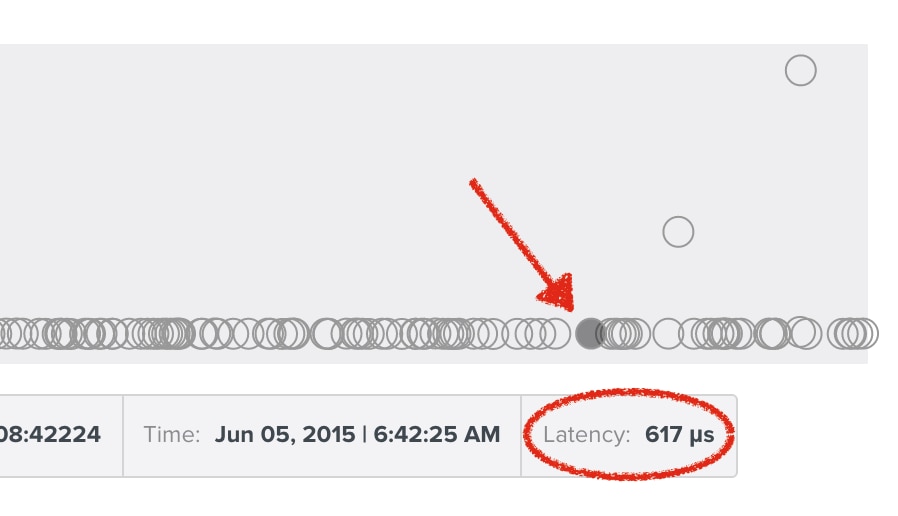 And the occasional outliers:
 If you’d like to see how your own systems stack up, SolarWinds DPM integrates Redis queries right into the overall Top Queries reports we generate, so you can see your entire application’s workload across all of your servers of all types, and then drill into them quickly. For example, here’s Top Queries by count on our production systems.
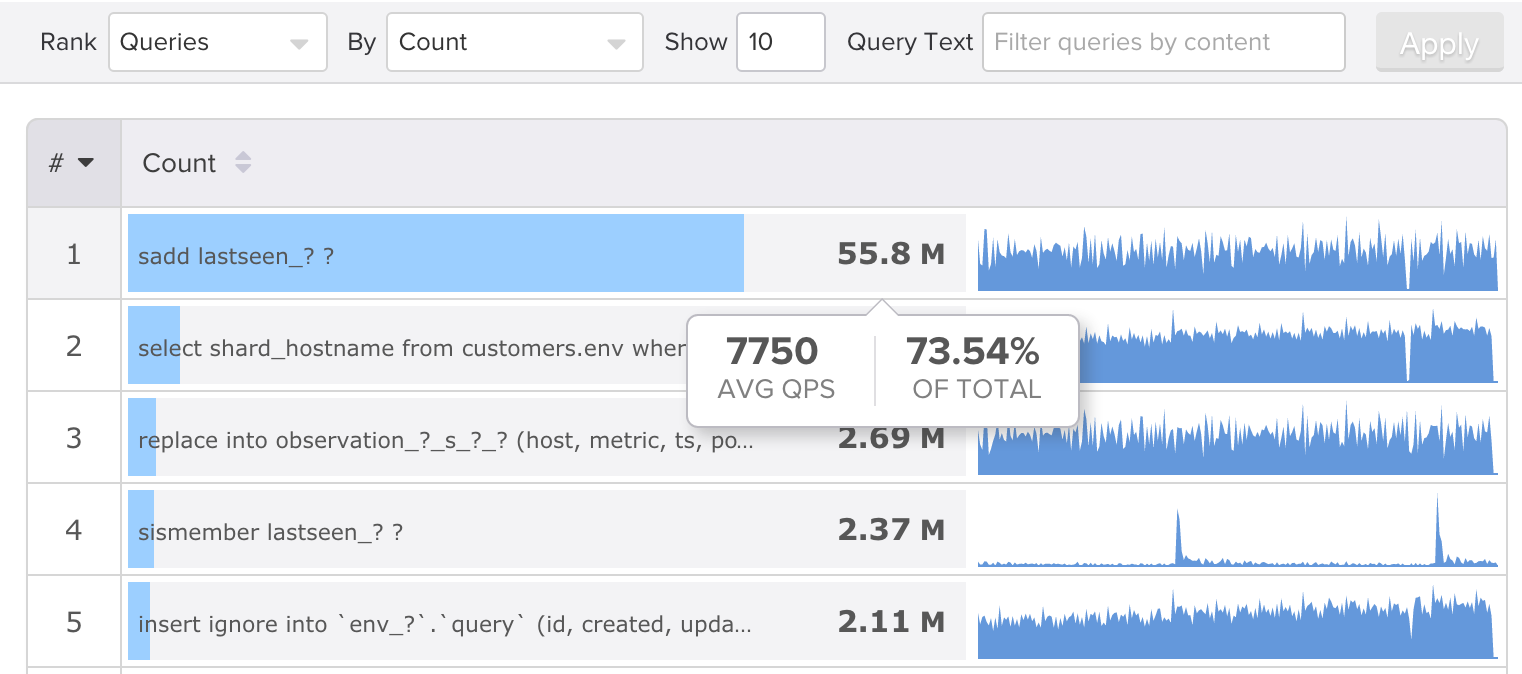 Notice how heavily we depend on Redis relative to MySQL. I wrote about this in a recent High Scalability blog post discussing how we make our backend metrics storage and processing scale.
That’s the other reason we added support for Redis monitoring, by the way: it’s really important to us. Before we built this functionality, we were flying just as blind as everyone else, without visibility into our Redis servers’ query traffic and workload.
Notice how heavily we depend on Redis relative to MySQL. I wrote about this in a recent High Scalability blog post discussing how we make our backend metrics storage and processing scale.
That’s the other reason we added support for Redis monitoring, by the way: it’s really important to us. Before we built this functionality, we were flying just as blind as everyone else, without visibility into our Redis servers’ query traffic and workload.
You Can Do This Too
If you’d like to take a look at your own Redis server performance and workload, you can sign up for a free trial of SolarWinds DPM.
One summary of SolarWinds DPM is "it will find things about your systems that you didn't know, and aren't sure you'd find out any other way."
— Baron Schwartz (@xaprb) June 4, 2015