The MySQL wire protocol includes useful result data and metadata, such as warnings and errors raised by the query. These often indicate bugs that will cause problems you may not discover for a long time, when the cleanup can be costly and damaging.
A quick background. If you’re not familiar with how this works, the server collects warnings from queries and stores them as part of your connection state. Warnings can be raised at many points during query execution, including while processing rows. Warnings aren’t part of the result, but there’s a set of metadata in the EOF packet that says how many warnings were raised. Errors, on the other hand,
are the response from the server.
The problem is, these errors and warnings can go undiscovered all too easily. This should be a concern to everyone: devs because they don’t know what their code is really doing, ops/DBA because they bear the burden of discovering and diagnosing such troubles, and management because errors are not only a risk to the business, but also make devs and ops staff unproductive and unhappy.
The solution is to make sure devs and DBAs have clear visibility into warnings and errors
in production as well as in dev/staging.
Using SHOW WARNINGS
Every new query wipes out the temporarily stored warnings and starts with a blank slate. You can see the warnings for the
last statement executed by running
SHOW WARNINGS.
What kind of warnings can we see with this? Here’s an example of a subtle bug. Suppose you have a table with columns
a and
b:
CREATE TABLE t (a int, b int);
Insert a bunch of rows with random values into that table, and then try this:
mysql> select a as b from t group by b order by a; .... 8 rows in set, 1 warning (0.00 sec) mysql> show warnings; +---------+------+--------------------------------------------+ | Level | Code | Message | +---------+------+--------------------------------------------+ | Warning | 1052 | Column 'b' in group statement is ambiguous | +---------+------+--------------------------------------------+
That bug’s subtle enough that you probably have to do a double-take to even figure out what it’s about. This is why warnings are so helpful. The problem is they’re often really hard to notice, and sometimes they depend on data or parameters, so you won’t see them in testing or staging environments.
If you run the statement above in the MySQL command-line client, you’ll see a notice of the warnings, but if you don’t use that client, odds are you’ll miss it. And if you don’t issue a
SHOW WARNINGS statement just after running your query, you won’t see the warnings.
Warnings In The Protocol, And Driver Support
The number of warnings is returned as part of the results, as I mentioned. That’s how the MySQL commandline client knows to print out
1 warning after the results.
Some, but not all, drivers expose this information to programming languages. Using it can be very helpful, but tedious.
For example, a long time and several employers ago, an upgrade to the Perl DBD::mysql driver added a property that let you inspect the warning count from the last statement. I suspected that we had a lot of queries that raised warnings, so when this property was added, I forked some of the core database interaction libraries and vendored them into our codebase.
I added a small change to look at an environment variable, which was not set in production. In production, the library worked without changes, but in testing and staging environments, the library looked for
warnings > 0. If this was true, it would immediately issue
SHOW WARNINGS, fetch the results, and throw them as an exception with
die(). This made a lot of tests start failing immediately, and several weeks’ worth of work and many bug fixes later, our codebase was much higher quality.
Finding Bugs In Production
This was a good change, but it certainly wasn’t enough. A lot of code with bugs didn’t get exercised in testing, and a lot of bugs depend on data, not just the schema and queries. This type of validation needs to happen all the time, in production.
But monkey-patching the database interaction libraries is far from ideal; the change I made helped with SQL code quality, but made the app code messier. And we were afraid to run it in production because it might cause vital processes to completely break and cause serious damage just because of some kind of info/note warning that might be casually generated.
This is an illustration of a general problem:
finding queries that cause warnings or errors in production is very difficult, yet production is the place you need to look for them.
Features For Finding Errors With SolarWinds® Database Performance Monitor
With SolarWinds Database Performance Monitor (DPM), finding impossible-to-notice errors is a lot easier, because we inspect your production query traffic and extract all of the errors, warnings, and other metadata that is generally overlooked. We expose this to you in a variety of ways.
One is the Events Dashboard, which contains summaries of queries that are having trouble:

You can quickly thin-slice, drag, select, and filter to drill into those events to find out more information, view sparklines of the event’s frequency, and more. We’ll also soon enhance the display to expand out the various cryptic values. For example, error 1064 is a SQL parse error, and we’ll let you inspect the actual query from this view as well. This feature is in active development.
Another way you can see query warnings and errors is with the Top Queries view. When you select a query in the main area, we show information about it in the right-hand sidebar. Here’s an example:
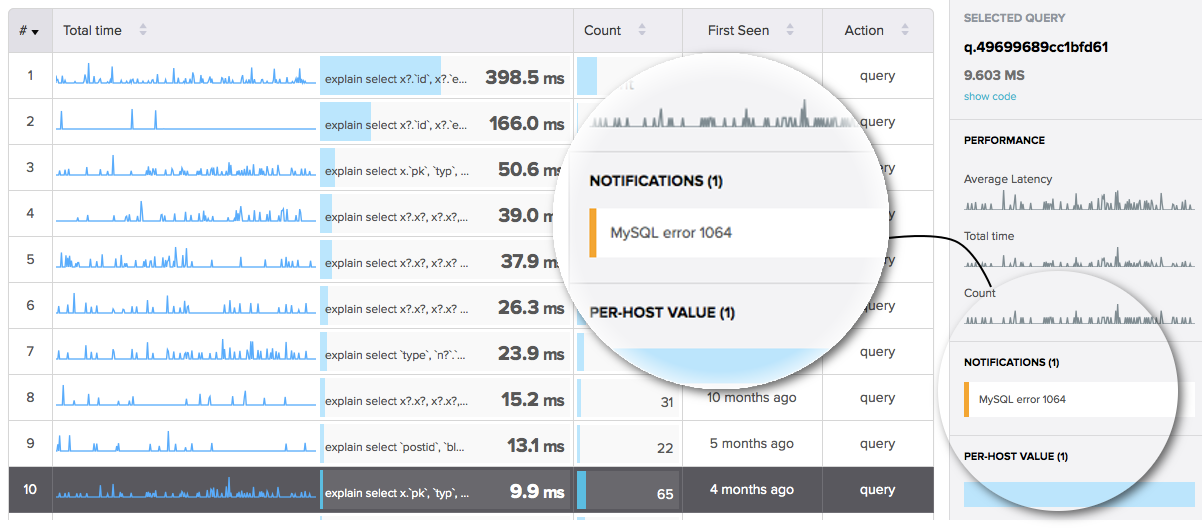
We’re quickly adding more ability to drill into these notifications and inspect errors and warnings even more easily, as well as alternative ways to discover errors and warnings.
Summary
Query warnings and errors are important signals from your server that something’s wrong. In many development environments, they’re really difficult for even DBAs to observe, let alone developers. It’s even harder in production. DPM's ability to capture and analyze production network traffic and do deep packet inspection gives developers a unique ability to self-service, relieving DBAs of the burden of helping developers figure out whether their code is misbehaving in subtly dangerous ways. This saves a lot of time and frustration for everyone and helps you create higher-quality apps faster, and avoid costly and damaging incidents later.