Anomaly detection sure is a hot topic. We’ve written about it ourselves a number of times, and Preetam Jinka and I just co authored a book for O’Reilly called
Anomaly Detection For Monitoring. One of the challenges, as we’ve discussed so often, is that catch-all, generic anomaly detection is hard to do.
In special cases, however, there’s often a niche use case that can be done well and is highly beneficial. Query behavior changes are an example of that, and I’m happy to announce that SolarWinds® Database Performance Monitor (DPM) now has advanced statistical algorithms running to detect important changes to your most important queries continually.
What does query anomaly detection mean? Good question! In general, a lot of anomaly detection techniques try to compare current behavior to past behavior and determine if we’re within ranges of expected behavior.
You’re probably familiar with various ways to do this, such as
Holt-Winters forecasting. HWF includes seasonality so you won’t have skewed expectations at 5am based on 5pm’s traffic, for example.
There are so many ways that system behavior can change, however, that most anomaly detection techniques alarm on lots of false positives. That is, they tell you something’s unusual far too often. To avoid this, we’ve taken a more sophisticated approach that we’ll write up in more detail later.
As for
what we check for anomalous changes, though, we’re again taking a very specific view of that. Database Performance Monitor measures many thousands of metrics per server every second (sometimes much more). We’re not going to check all of those; as I’ve discussed previously, it’s vital to understand the meaning of the metrics and only check meaningful metrics in sensible ways.
In brief, we look for anomalous changes in
query metrics first of all:
- For each category of queries, we detect changes in frequency, total accumulated time, and latency
- We detect important changes in overall error and warning rate, globally (not per-category-of-query)
There are more metrics we’re approaching cautiously, including some system metrics, but this is a starting point. As we’ve said many times, databases are meant to execute queries, so by far the most important thing to monitor about a database is is high-definition query monitoring. We monitor MySQL, PostgreSQL, Redis, and MongoDB queries, and all of these automatically get anomaly detection as a result.
We take various steps to avoid false positives, including accounting for multiple kinds of seasonality. We also suppress anomaly detection if a query isn’t very important–that is, if it’s not a heavy-hitter–relative to the overall workload.
The result is dynamically generated, intelligent baselining that is biased towards avoiding false-positive events. It might be more sophisticated than the “baselines” you might be accustomed to in many monitoring products. It detects changes such as the following on one of our Redis servers.

Anomaly detection uses our standard Events functionality, creating an event with details of the anomaly in the query metric. As a result, you can easily configure alerts for the event, using email or any of our standard integrations (Slack, HipChat, PagerDuty, VictorOps, and more) to get notified.
Of course, you can also inspect the anomalies in context. The events are deep-linked to the query’s summary dashboard, where you can not only look at the metrics, but also examine individual samples, use Compare Queries to compare across time ranges, and more.

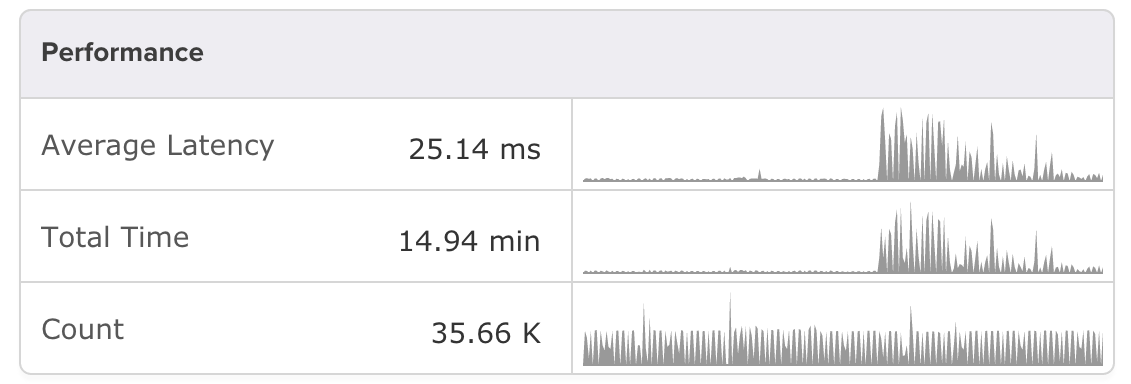
Clearly that query suddenly became drastically slower around this time. The frequency didn’t change, but something else did. Armed with that knowledge, you can dig in and figure out what and why.
Our query anomaly detection features have been running in production for all of our customers for a while, although we didn’t publicize it previously. We wanted to take more time and examine the anomaly detection algorithm’s behavior across a variety of customer workloads and ensure that we aren’t spamming anyone with false positives.
If you’d like help with anything you see in
Database Performance Monitor, please chat with us using the in-app support chat at the bottom left of the app. We’ll be glad to help investigate or take a look at anything you’d like to know more about.
 Anomaly detection uses our standard Events functionality, creating an event with details of the anomaly in the query metric. As a result, you can easily configure alerts for the event, using email or any of our standard integrations (Slack, HipChat, PagerDuty, VictorOps, and more) to get notified.
Of course, you can also inspect the anomalies in context. The events are deep-linked to the query’s summary dashboard, where you can not only look at the metrics, but also examine individual samples, use Compare Queries to compare across time ranges, and more.
 Clearly that query suddenly became drastically slower around this time. The frequency didn’t change, but something else did. Armed with that knowledge, you can dig in and figure out what and why.
Our query anomaly detection features have been running in production for all of our customers for a while, although we didn’t publicize it previously. We wanted to take more time and examine the anomaly detection algorithm’s behavior across a variety of customer workloads and ensure that we aren’t spamming anyone with false positives.
If you’d like help with anything you see in Database Performance Monitor, please chat with us using the in-app support chat at the bottom left of the app. We’ll be glad to help investigate or take a look at anything you’d like to know more about.


