We get a lot of questions about what our Adaptive Fault Detection algorithm really is and how it works. Although I can’t tell you exact details, I want to explain a few things about what our algorithm is and what kind of results it can deliver. I get a lot of questions about it that assume it’s just anomaly detection, so I’ll cover that. I will also show a couple of representative faults our system has detected.
What Is A Fault?
In simplest terms, a fault is a momentary stall, where requests for work (queries, IO operations) continue to arrive but are not being serviced.
Our fault detection algorithm is based on queueing theory, and observes work requests arriving, in progress, and completing. When work continues to arrive, queues up, and does not complete, the system is stalled.
Faults are typically caused by system overload or poor performance. Either something is demanding more than it should from the system, or the system is under-performing.
Typical causes include resource overload/saturation, storms of queries, bad application behavior, SELECT FOR UPDATE or other locking queries, internal scalability problems such as mutex contention around a long-running operation, or intensive periodic tasks. For example, the query cache mutex in MySQL has caused server stalls, and InnoDB checkpoint stalls or dirty-page flushing can cause similar effects. In the application layer, bad behavior such as stampedes to regenerate an expired cache entry are common culprits.
SolarWinds Database Performance Monitor (DPM) currently detects faults in storage (block devices) and in MySQL. We plan to extend this much further in the future. The algorithm itself is generic.
How Are Faults Detected?
SolarWinds DPM detects faults in very fine detail – as small as one second, currently. We can refine that level of detail as much as we want in the future, but 1 second is useful for now. Fault detection is practically free in terms of CPU and memory cost. It’s extremely efficient.
As far as the algorithm itself: There are thousands of potential causes for stalls, and it is impossible to guess what metrics and thresholds might predict them. That’s the nice thing about an adaptive algorithm. What really enables our algorithm is our definition of a fault:
work isn’t getting done. This process is completely configuration-free and requires no tuning, and because the definition of a fault is based on work being completed, will detect any problem that prevents the system from doing its work, even those we have never seen or imagined.
Why Should You Care About Faults?
Because faults are practically impossible to detect reliably by normal means such as threshold-based alerts, they are often extremely hard to find until they become major problems (many seconds or minutes of downtime). They are some of the most difficult problems to diagnose, because of their transient nature, which makes them hard to observe. The symptoms and causes tend to be complex, because systems that stall often misbehave in a large variety of ways simultaneously.
Finding faults while they are small can avoid serious outages later.
When faults get worse, systems tend to turn into complete chaos, with all kinds of messiness obscuring the original cause. It becomes impossible to tell the noise from the signal.
For these reasons, faults are best detected while they are small (a second or two). Short-duration faults are much easier to diagnose and fix.
What Does DPM Do With Faults?
When a fault occurs, our agents react immediately by gathering additional data at high frequency for a few moments. Faults appear as events in the Events Dashboard, and there is a dashboard specifically designed for investigating and diagnosing them.
Is Fault Detection Just Anomaly Detection?
Our fault detection algorithm uses a form of anomaly detection in part of its operation, but that’s not the whole story. Anomaly detection will tell you what’s abnormal, but there’s a crucial difference between abnormal and “bad.”
Anomaly detection generally creates lots of noise. To illustrate, suppose you measure things in 1-second granularity, as we do. (Any less frequent is really not all that helpful for our use cases.) Let’s say you want to detect “six-sigma” anomalies – a very restrictive limit, in terms of usual methods like statistical process control. A six-sigma outlier occurs only 2 times in a thousand. That means you’ll get about 7 outliers per hour per metric. If you gather thousands of metrics from each system per second, you can expect many thousands of “unusual, anomalous” metrics per hour.
You might think
that’s because the algorithms aren’t sophisticated enough, or
those aren’t really anomalies. To be clear, we have used sophisticated algorithms, and there
are really anomalies – all you have to do is manually inspect some of them and you’ll see they are clearly bizarre outliers from normal behavior. This is because
systems are continually anomalous in a variety of ways. We humans tend to greatly underestimate how crazily our systems behave all the time.
Another reason to be skeptical of pure anomaly detection is the trade-off of sensitivity versus specificity. In simple terms, any usable algorithm needs to have a much lower false-alarm rate, and a much lower missed-alarm rate, than you’d intuitively expect. (Intuition tends to be really wrong in a lot of statistical applications.) We had a few problems with false-positive faults in our algorithms too, and have been honing them continually for almost two years now. I personally have been working on this general area of research for probably close to 5 years. This is not a simple problem and the solution isn’t something simple or obvious like outlier detection.
So, no. Anomaly detection and fault detection are absolutely not the same thing. Our experience is that even sophisticated anomaly detection algorithms will not reliably detect true faults in a server. They will miss most true faults and alarm you on things that are just “normal abnormality.”
What Are Some Examples Of Faults?
We will share two representative examples of faults on our own servers. These are typical events. (We don’t have many, but these are run-of-the-mill for what we see in systems in general.)
The best way to show a quick high-level summary of these events is to use screenshots of our fault analysis dashboard. By clicking on the fault event, you get a diagnostic summary. Here’s a snippet of the first one.

This is a fault in the disk subsystem. We get a lot of these because of EBS volume stalls, but typically we don’t care. In this case, however, the fault occurred because of the abusive activity of a program called clean-metrics. This background worker program helps us clean up some data that’s become orphaned as old data is purged. We had a problem with this job on one server, and it got behind in its work. When it ran again, it deleted way too much data in one big chunk, and that overloaded the disk. This is an absolute smoking gun. You can see it impacting the network, piling up hundreds of pending IO requests, and stalling IO requests to the disk, all at the same time.
Here’s another example:
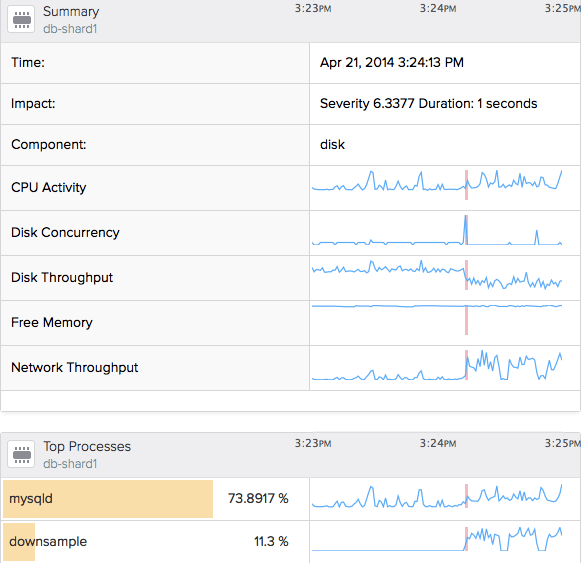
This is also a job that got behind and had too much work to do, in this case a metrics down sampling program. You can again see it impacting the disk concurrency and throughput, and the network throughput. Notice that the fault itself only lasted about a second, although the program ran for much longer than that. That’s because the program’s normal work takes a long time, and doesn’t constitute a fault. What is a fault is when the system gets stalled by the initial “get ready to do work” query, which blocked a lot of activity on the system.
In both cases, these programs were written to do as much work as was available, instead of doing the work in small batches. Solving these problems is pretty easy: do things in small bites, not a giant gulp.
What’s interesting is that there wasn’t really a noticeable impact to our systems. No downtime, no serious problems. But we were able to catch these potential problems while they were very small, before humans would ever be able to notice them, and prevent them from turning into major incidents.
I could show some customer success stories, too, but I don’t have permission. I’ll just quote one customer anonymously, using their own words. Right after installing, they told us
Fault detection found a particularly bad query that causes our whole system and other queries on the system to slow down. It runs often, but without DPM was invisible. We don’t have the insight, without this level of monitoring, to find queries that cause short impact to servers.
Shortly thereafter they found another, too. Both problems would have been quite difficult to detect and solve by other means.
Conclusion
DPM’s Adaptive Fault Detection technology is an efficient, sensitive, zero-configuration way to find small stalls in systems (currently MySQL and disk).
Fault detection is not anomaly detection. It’s based on a model of work being processed by your system – it’s based on queuing theory and Little’s Law. Anomaly detection just tells you what’s unusual, not what’s bad. There’s a big difference.
It’s not a panacea, but it’s a really useful tool in your toolbox, and works well for detecting problems that are otherwise among the most difficult to find and diagnose.
Try it out – there’s a free trial for a month.
Sign up here and see what you find.