Home > Why Adaptive Fault Detection is Powerful and Unique

Why Adaptive Fault Detection is Powerful and Unique

Adaptive Fault Detection is a patented, algorithm-based technology and one of the important central components of the SolarWinds® Database Performance Monitor (DPM). Unlike other monitoring methodologies — such as anomaly detection or threshold alerting — adaptive fault detection is designed to detect events that are, by definition, detrimental to a system. It looks for issues that actually prevent work from completing — not just anomalies or outliers. With this quick blog post, we want to help readers understand the definition and value of fault detection. To do so, it helps to delve into several key concepts:
  • Why is it important to identify faults?
  • How does SolarWinds DPM detect faults?
  • How does our app help users address faults when they appear?
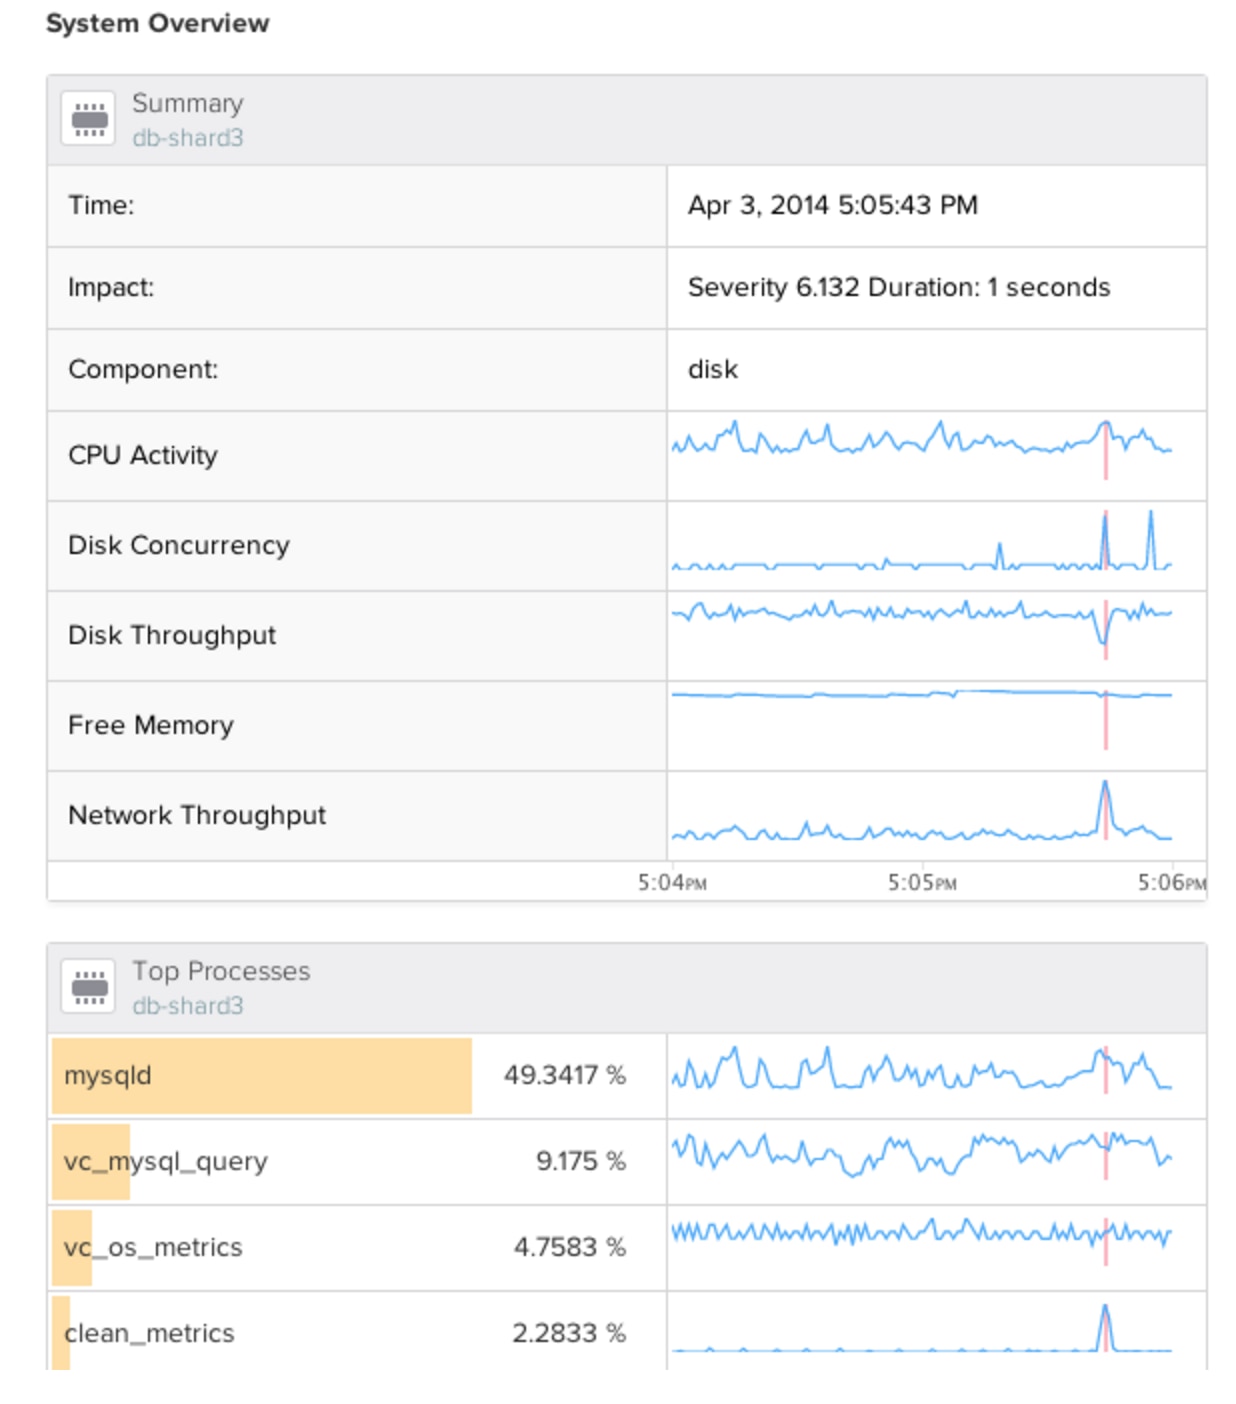
Why is it important to identify faults? A fault is most easily defined as a certain kind of momentary stall. Specifically, it's when a system fails to service requests for work (i.e. queries, IO operations) even though those requests continue to arrive. In other words, the work continues to line up, but it can’t complete. It's earmarked by a bottleneck, even if it's extremely brief. Faults are typically caused by system overload or poor performance, when something demands more than it should from the system, or when the system is simply underperforming, resulting in a back-up. This can occur for a variety of reasons, including resource overload/saturation, internal scalability problems, intensive periodic tasks, or a number of other things. In any case, the occurrence of a fault can be understood to represent a moment when a system fails to perform work effectively. There are many instances when a fault will initially appear only momentarily and then resolve itself, as the system catches back up; the only symptom of such an issue might be a mere one-second stall. This often makes faults transient and extremely difficult to detect without specifically designed detection. Likewise, the symptoms and causes of faults tend to be complex, because systems that stall have often misbehaved in a variety of ways, meaning there’s often no single cause-effect relationship to track down. But why is it important for users to take note of seemingly small problems? Well, system performance problems almost always start small and, overtime, snowball into much more serious issues. Catching them early is the best way to prevent major performance problems and outages. Those seemingly benign, virtually invisible hiccups can compound into something severe if given time. That’s why faults are best dealt with while they’re still small (lasting only a second or two). Short-duration faults are much easier to diagnose and fix. When they’re bigger, there’s more to untangle. How does SolarWinds DPM detect faults? As Baron Schwartz wrote in a previous blog post, faults are decidedly different from anomalies and other notable events, which means the method for detecting them must be more precise than simply pinpointing outliers. Instead, our fault detection algorithm is based on queueing theory, a very potent concept that Baron has written about in detail. There are so many factors that can cause a fault that we’ve determined the most effective way to find them is by defining their most significant upshot: work isn’t getting done. This rationale guides our algorithm and lets us see faults based on the effects they produce in a system, rather than their sources, which can be manifold and very hard to predict. This is what we mean when we say that SolarWinds DPM has a “work-centric worldview.” Using advanced statistics and machine learning, SolarWinds DPM's Fault Detection is completely adaptive and self-tuning – it doesn’t require any configuration. The program can detect faults as short as one second in duration. Even the most attentive user would likely fail to notice system stalls so small, but with our adaptive fault detection, they’re easily diagnosed and solved. On top of that, the algorithm is incredibly efficient, practically free for a system’s CPU and memory.   How does the app help users address faults when they appear? When a fault occurs, our agents react immediately by gathering additional data at high frequency for a few moments. Faults then appear as events in the Faults Dashboard, easily accessible from the app’s navigation pane. They’re displayed in a timeline, from left to right, accompanied by widgets that show what was happening in the server at the specific moment of the fault. You can click on any fault to examine it, and a two-column display will appear below. The left-hand pane displays summary information about activity and status in the faulty system during the affected time period, with vertical red lines indicating the moment of the fault. Here’s an example: Fault_Detection.png From there, diagnosis requires application-specific knowledge, but in summary, this application is a background task that executed an expensive DELETE statement against the database, which then issued a large set of I/O requests to the disk. The Value of Fault Detection Ultimately, Adaptive Fault Detection shows you inherently valuable information — the ability for work to complete — and guides you to the clues you need to proactively fix or prevent an issue. Fault detection isn’t the same as other monitoring approaches, and it has the potential to reveal parts of your system that nothing else can. While it’s not an instant antidote for all monitoring woes — there's no such thing — it’s an important type of visibility to have available and at your disposal, and will reveal much about your system, especially when used in conjunction with other medtods.
Avatar photo
SolarWinds
We’re Geekbuilt.® Developed by network and systems engineers who know what it takes to manage today's dynamic IT environments, SolarWinds has a deep connection to…
Read more