There are manifold ways to collect, visualize, and analyze data… but not all methods are equally useful. SolarWinds® Database Performance Monitor (DPM) however, is singular as a database-centric SaaS monitoring platform, and it's designed to provide you with powerful insights into your system that are both inherently actionable and unique. Within minutes of first booting up SolarWinds DPM, users frequently discover new aspects of their system. They understand it in brand new ways, just by viewing our app’s basic dashboards and metrics.
But that's just the start. Even beyond those initial revelations, there are many more powerful insights that SolarWinds DPM can provide, if you know how and where to look. These views aren’t entirely automatic, but they’re simple to discover with a few tips. Here are 5 insights easy to see with SolarWinds DPM.
Find which queries affect the most rows
Understanding which queries are affecting the highest number of rows in your system is a useful way to understand the amount of change occurring in your dataset. By organizing this change as “affected rows,” you’re seeing these developments in terms of a powerful, raw metric. “Affected rows” refers to any row that was changed by an UPDATE, INSERT, or DELETE, based based on the OK Packet or Performance_schema data.
To view queries organized in terms of affected rows, head to the Profiler and then rank “Queries” by “Affected Rows.”
The Profiler will generate a view like this one, giving you immediate, legible insight into which queries are causing the widest range of change.

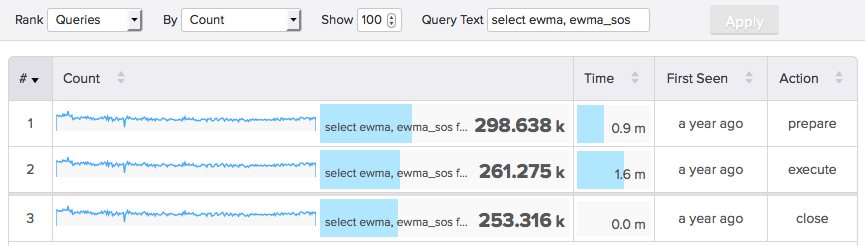
Find the largest group of similarly grouped queries
If you’re able to see the largest group of similar queries, it gives you a window into application behavior, which, in turn, can be used for sharding decisions and other growth strategies. No small thing. Alternatively, examining query verbs can very quickly show you the read to write ratio of a workload, which can be leveraged at further decision points.
To view queries this way, head back to the Profiler and rank them according to “Count.” You’ll then see the total number of queries, grouped similarity and organized by quantity. Alternatively, you can rank “Query Verbs” in the same way and retrieve the number according to command type. In both cases, you see which queries are executing the most frequently in your system.

Find memory allocation stalls
As explained by the kernel documentation, memory allocation stalls refer to times when a process stalls to run memory compaction so that a sizable page is free for use. With SolarWinds DPM, you’re able to see the number of times this happens in a given timeframe, allowing for further investigation. To do so, head to the Metrics dashboard and enter the metric text as “os.mem.compact_stalls”.


Find IO Wait
IO Wait — the time the CPU waits for IO to complete — can cause stalls for page requests that memory buffers are unable to fulfill and during background page flushing. All of this can have widespread impacts on database performance and stability. Using the metrics dashboard in SolarWinds DPM, you’re able to see these stalls by duration over time and broken down by host.
 In the Metrics dashboard, use “os.cpu.io_wait_us” as the metric text.

Find long running transactions
Also in the metrics dashboard, you can see long running transactions by viewing the redo segment history length, which, in turn, represents transaction redo segment history length. This is essentially the overhead of yet-to-be-purged MVCC.
Naturally, seeing spikes of long running transactions and providing explanation for this overhead is a valuable ability — and easily accomplished with DPM. Just use the metric text “mysql.status.i_s_innodb_metrics.trx_rseg_history_len”.


Want to see more?
These tips and insights just scratch the surface. SolarWinds DPM has much more visibility available to anybody interested in seeing SaaS, database-centric monitoring in action.