SolarWinds® Database Performance Monitor (DPM) has support for monitoring Citus, a scale-out solution for massively sharded data storage and processing using standard open-source PostgreSQL. Citus (previously known as CitusDB) layers an additional set of capabilities on top of PostgreSQL. The result is a powerful distributed database that shards your data and lets you ingest a firehose of data, while running complex real-time analytics queries in parallel across nodes for blazing fast performance.
All the sharding and MPP processing is done for you, without the typical mess and hassle of building your own sharding into your app (we did this in our own backend, and wish we hadn’t needed to!)
Citus is built on PostgreSQL’s powerful extensibility, which resides in the layers
above the storage engine, allowing sophisticated functionality to be plugged into the parser, planner, executor, and so on. This is in contrast to MySQL or MongoDB, which are mainly extensible by putting a different storage engine
underneath the database. It may not be obvious at first which way is better, but once you’ve tried both approaches you’ll appreciate Postgres’s.
Citus works by using two types of PostgreSQL nodes: workers and coordinators. Coordinators store cluster state, including the location of data shards and which nodes belong to the cluster. Queries go to coordinators, which distribute the queries to workers for execution. Depending on the sharding scheme, which is user-defined, queries may touch a single node, or may be cross-node or cross-shard. When possible, they are executed in parallel. Worker nodes store all of the data and do most of the work, as their name implies. When workers return a result, it goes to the coordinator, which may perform some additional processing such as aggregating results in scatter-gather fashion.
Some Citus customers are very public about their use of it, including Heap and CloudFlare. We have a number of customers using Citus. Given the presence of Citus in our customer base and in the PostgreSQL community, it was an easy decision to build support specifically for it.
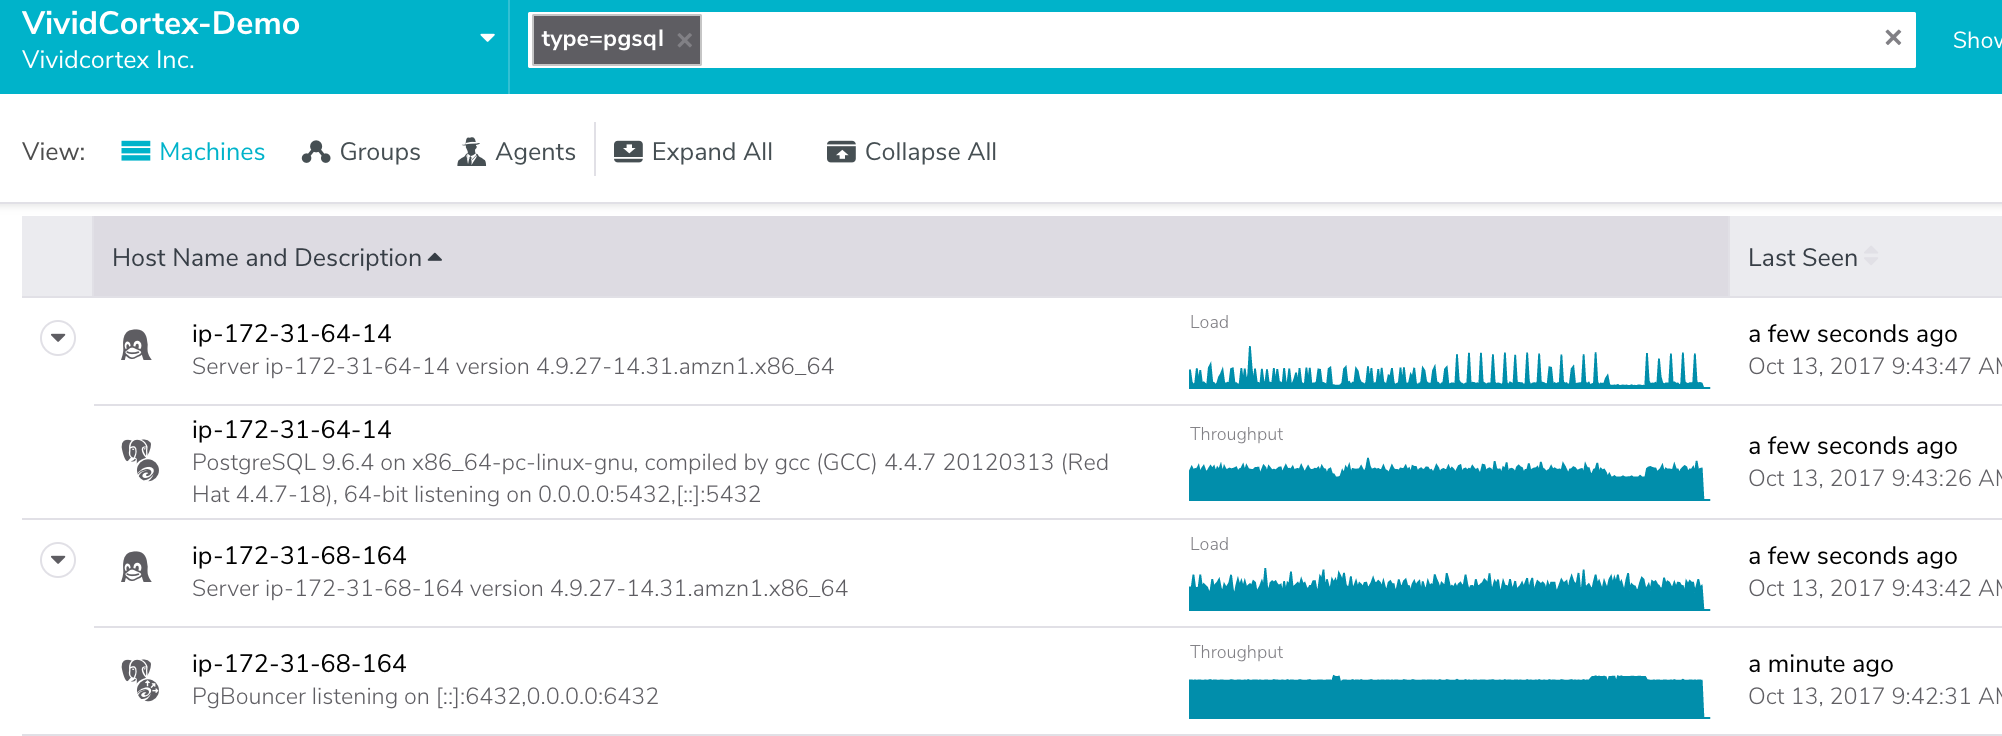
SolarWinds DPM detects when a PostgreSQL node is a Citus worker or coordinator. We “badge” the host’s elephant icon with a worker or coordinator indicator, as shown in the screenshot:

Coordinator nodes also emit additional metrics on the number of workers in the cluster, and whether they’re active or idle. We capture those metrics, along with all of the standard and advanced Postgres metrics. Citus is just raw Postgres underneath, so monitoring each individual node is no different than normal Postgres monitoring.
But the real magic of DPM's support for Citus is the clusterwide query monitoring. We track every transaction and query arriving and completing at every Citus node, including the coordinator node. So you get an amazing view of what your entire Citus database cluster is doing, with seamless and quick drilldown into any node. This goes all the way down to individual executions of queries, EXPLAIN plans, and so on as usual with DPM.
The end result is the ability to understand, optimize, and troubleshoot your database’s behavior and workload, both at the top level (cluster==database!) and individually. And as anyone who’s run a large distributed system knows, this is vital: node-by-node monitoring is a route to madness.
Citus is open-source and evolving quickly. We look forward to many more great things to come, and will keep an eye out for how we can help Citus customers succeed!


