Balancing growth and performance optimization is a constant tension in all aspects of business. This is particularly true in DevOps, where there’s a drive to release more features faster to out-pace the competition and a need to stabilize and optimize existing system performance to deliver the best user experience. Yet most DevOps budgets and resources are shrinking. With each release, teams are forced to make difficult trade-off decisions. How can you ensure you are striking the right balance and meeting the needs of new and existing users and the business?
Just A Part of the Job
There is an inherent tension between building new features and optimizing the performance of existing features. It was around in waterfall development, through agile, and now in DevOps. This tension arises from a finite set of resources (time, budget, personnel) and the need to prioritize between competing goals.
Building new features:

Optimizing performance:

Not managing these competing priorities can lead to several challenges:
Metrics can play a crucial role in managing these tensions by providing data-driven insights to inform decisions. They can help:
Identifying, measuring, and communicating meaningful metrics can help each DevOps team member prioritize more efficiently. The right metrics can serve as a north star and align prioritization decisions to achieve business and technical objectives. Regularly monitoring and communicating progress toward objectives empowers team members to make informed decisions, make course corrections, and work toward continual improvement. To strike the right balance, teams must select metrics that span performance and development objectives.
Performance Metrics
Everyone is familiar with key performance metrics (KPIs) that gauge the health, performance, and resilience of a SaaS system. These metrics can be used to optimize the performance of preproduction and production systems and can be broadly categorized into four main areas:
Availability and uptime:
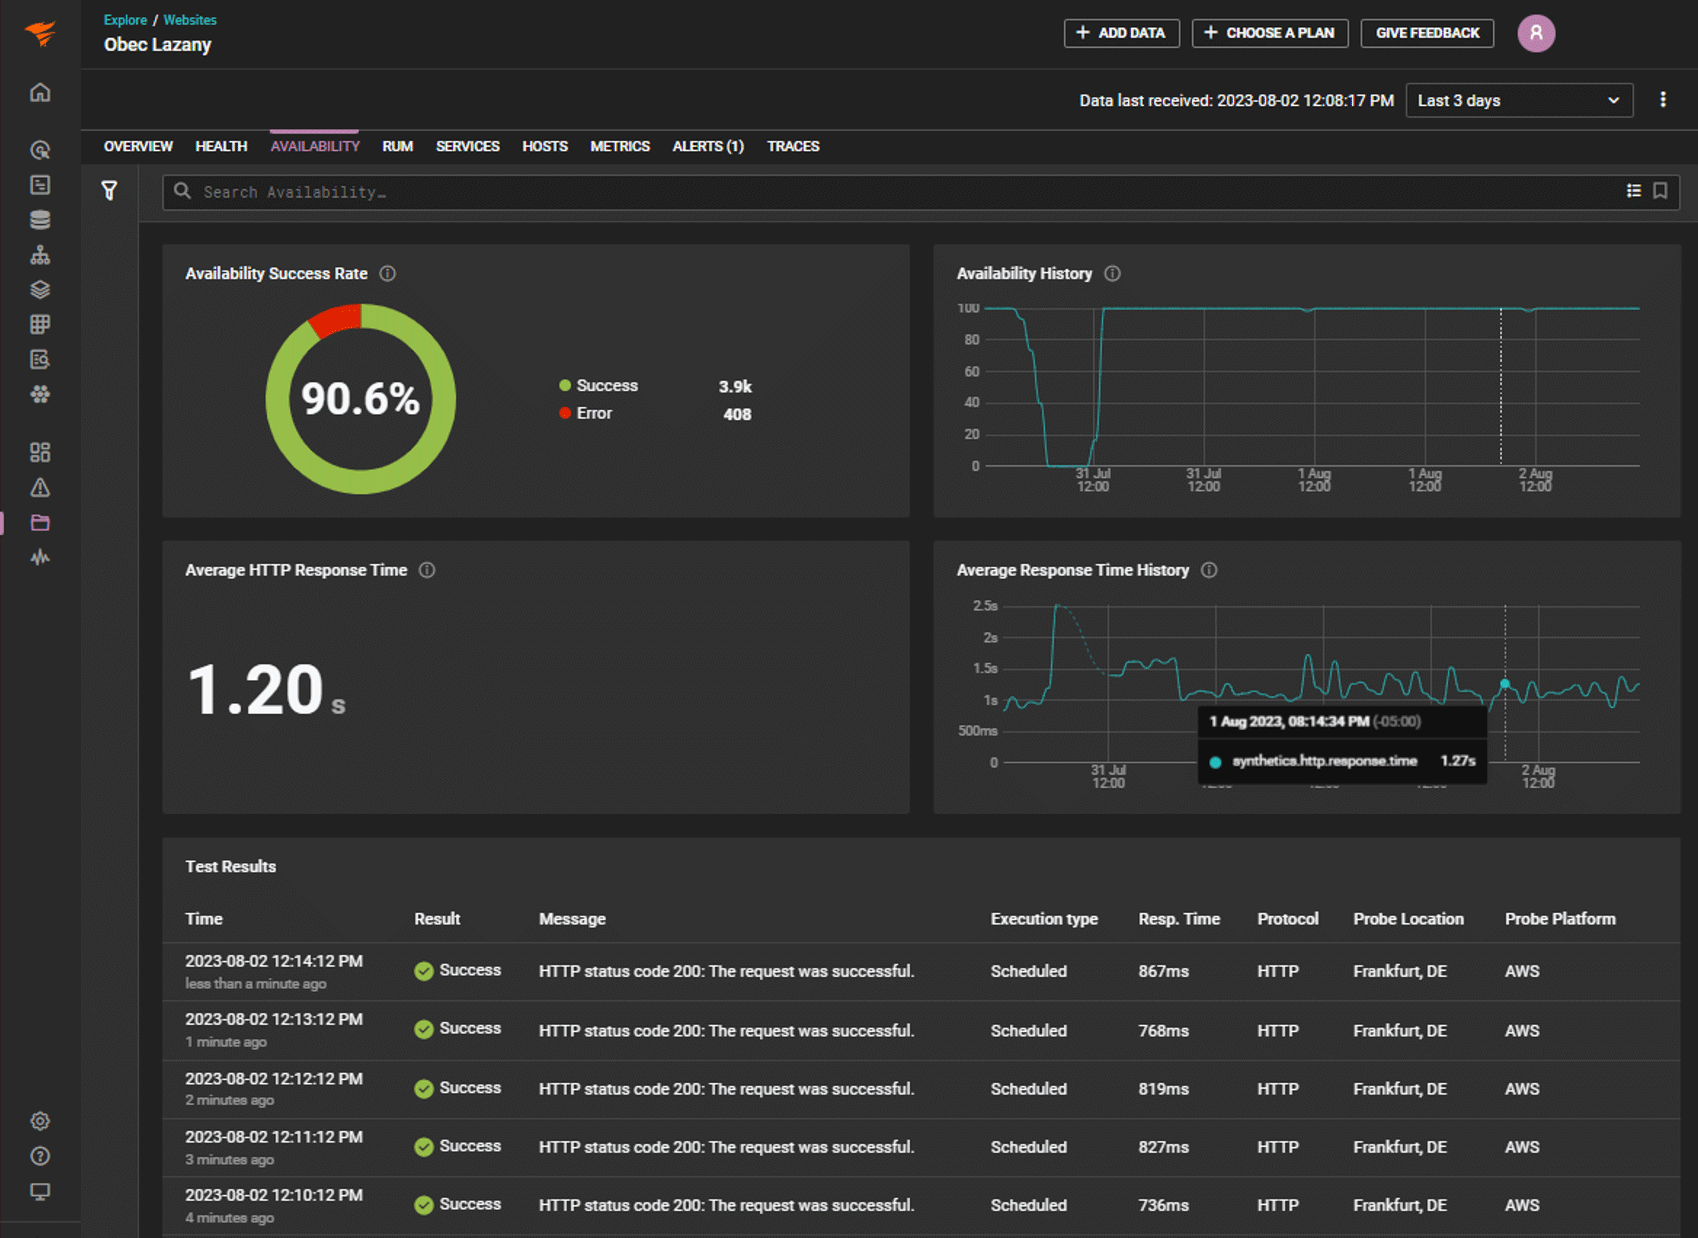
 Availability and response time metrics displayed in SolarWinds Observability SaaS (formerly known as SolarWinds Observability)
Performance and speed:
Resource utilization:
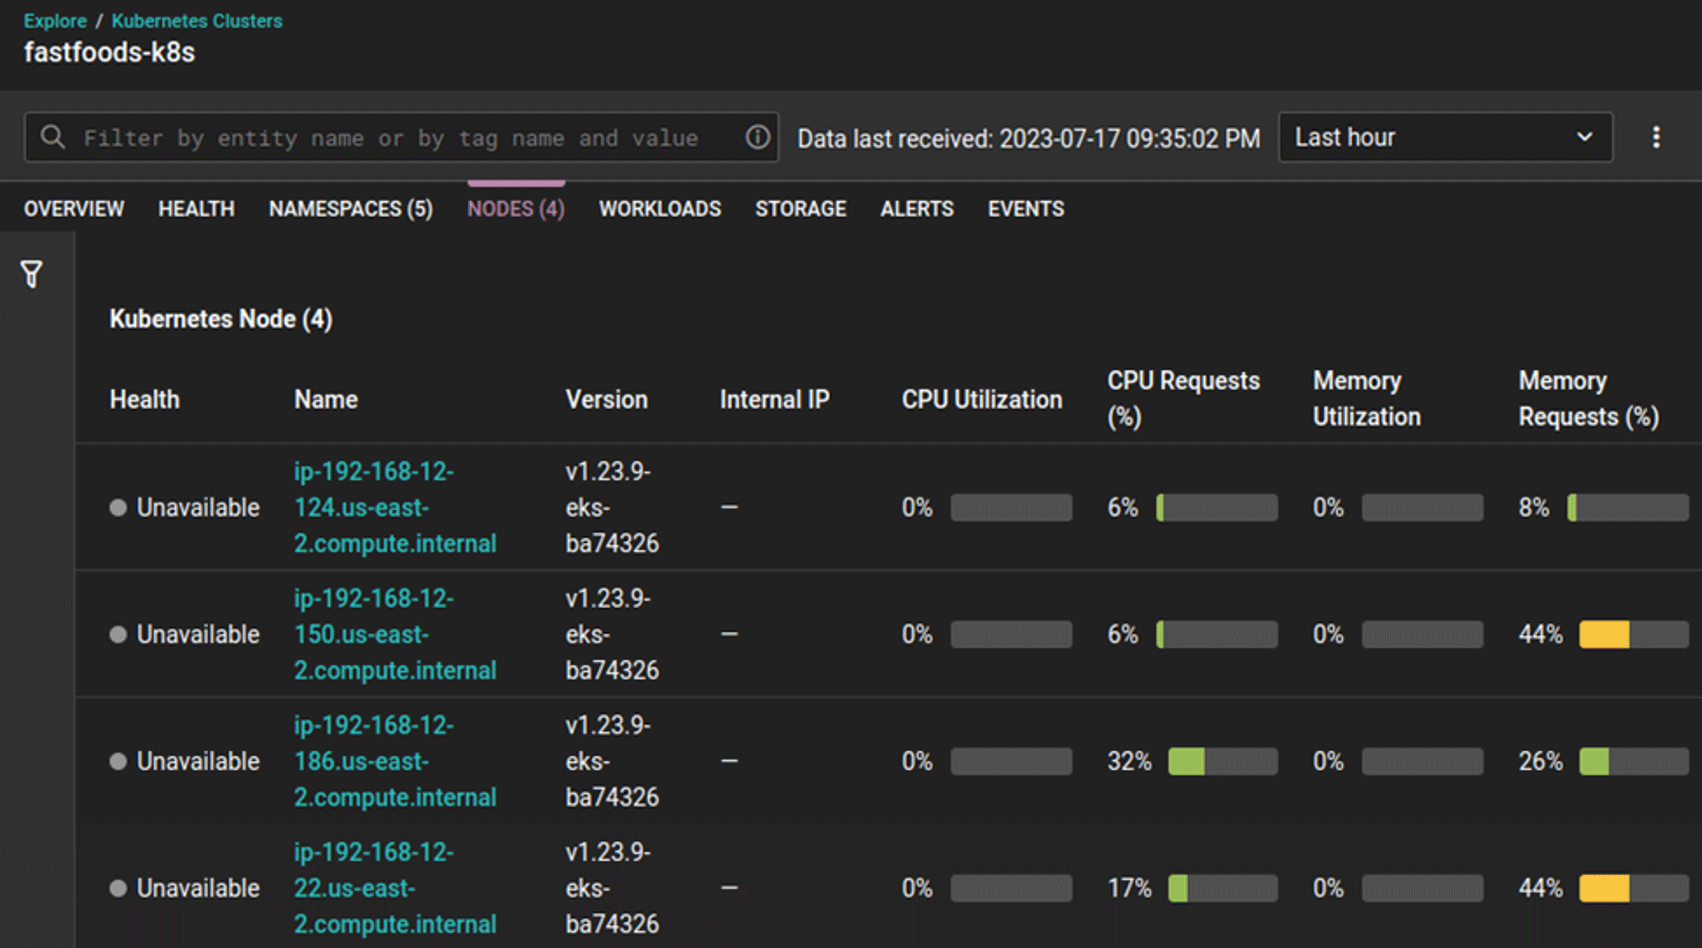
 CPU and memory utilization metrics displayed in SolarWinds Observability SaaS (formerly known as SolarWinds Observability)
Error rates and stability:
Development and Release Metrics
While performance metrics such as uptime, error rates, and response time have been used since the 1970s to measure system performance, it was with the rise of Agile and DevOps release metrics became more common. First, the adoption of Agile and the focus on continuous improvement created a need to measure common release metrics such as deployment frequency to track improvements. Then DevOps expanded the definition of release to include the entire software delivery pipeline and increased focus on performance across the DevOps team.
In 2014, a research initiative at Google Cloud Platform, the DevOps Research and Assessment (DORA), performed its first study on the practices of software delivery teams. The DORA survey and report aim to understand the capabilities that drive software delivery and operations performance.
The survey of DevOps professionals is conducted annually and measures release performance across a variety of release, performance, and business metrics. The DORA report is widely cited by industry analysts and thought leaders. It is a valuable resource for anyone interested in learning more about DevOps practices and how to improve their own team's performance.
The DORA metrics have become widely accepted as a standard for measuring software delivery performance. They are used by teams of all sizes and in all industries to track their progress and identify areas for improvement. They are composed of a set of four metrics designed to be used to measure the performance of software development teams.
Using these metrics and comparing outcomes across a variety of teams, the DORA team found that high-performing teams have significantly higher deployment frequencies, shorter lead times for changes, lower change failure rates, and faster MTTRs than low-performing teams.
Performance and Release Metrics Together
Release delivery metrics and performance metrics work together to paint a holistic picture of your custom application's health and effectiveness. Measuring and analyzing both types of metrics provides the perspective needed to inform better prioritization and trade-off decisions.
Release Delivery Metrics: Track the predictability, efficiency, and quality of the release cycle. These may include:
Performance Metrics: Measure the application's ability to meet user expectations and business objectives. These may include:
At a high level, release metrics measure the efficiency and quality of the delivery pipeline, while performance metrics identify areas for improvement. Both sets of metrics come together to provide a complete picture of application health. Using this combined insight, you can make informed decisions to optimize your development process, enhance application performance, and ultimately deliver greater value to your users and business.
Wrapping up
A challenge teams face regularly is finding the perfect balance between driving new feature development and optimizing system performance. Tracking and analyzing a combined set of release and performance metrics captures both objectives and offers deep insight into an application's strengths and weaknesses. For example, devoting resources to delivering more features more quickly may feel like progress. Still, if those new features add instability or degrade system performance, additional resources may be needed for troubleshooting and bug fixes. In the same way, identifying performance issues can highlight areas for improvement in the system and release process.
Release delivery and application performance metrics are complementary and work together to provide a complete understanding of application health. To operationalize this approach, select the metrics to track based on your goals and identify and put in place tools, like SolarWinds Observability SaaS (formerly known as SolarWinds Observability), to collect and analyze the data. SolarWinds Observability SaaS (formerly known as SolarWinds Observability) provides a full-stack monitoring solution connecting the data points across web applications and back-end systems to streamline management and provide actionable insights. If you want to try it for yourself, sign up for a fully functional 30-day free trial of SolarWinds Observability SaaS (formerly known as SolarWinds Observability).


