Last month, we published our newest, free ebook,
Sampling a Stream of Events With a Probabilistic Sketch, examining the way that SolarWinds
® Database Performance Monitor uses a sophisticated technique to select representative samples of query traffic on database servers. In this post, we'd like to explore the actual anatomy and nature of a sketch.
First of all, the value of using a sketch to make event selections is that it lets us process massive events streams; it lets us understand something huge and apply that knowledge toward a useful end. In the world of modern Big Data, stream processing is a vital tool that saves teams and organizations time and money, cutting through the titanic task of digesting such masses of information.
What is a Sketch?
A sketch is a compact, probabilistic data structure that trades off accuracy for resources. A
bloom filter is one example of a sketch: it replaces an exact yes/no set membership question with an approximate probably/no question, at vastly cheaper cost.
The sketch we used is somewhat novel. We later found a published paper describing what we’d done, but at the time we were unaware of that. We were inspired by the
Count-Min sketch, which counts approximately how many times events have been seen, per category. Instead of counting the number of events per category, we kept track of the last-seen timestamp per category.
It works a little like this (scaled down for simplicity):
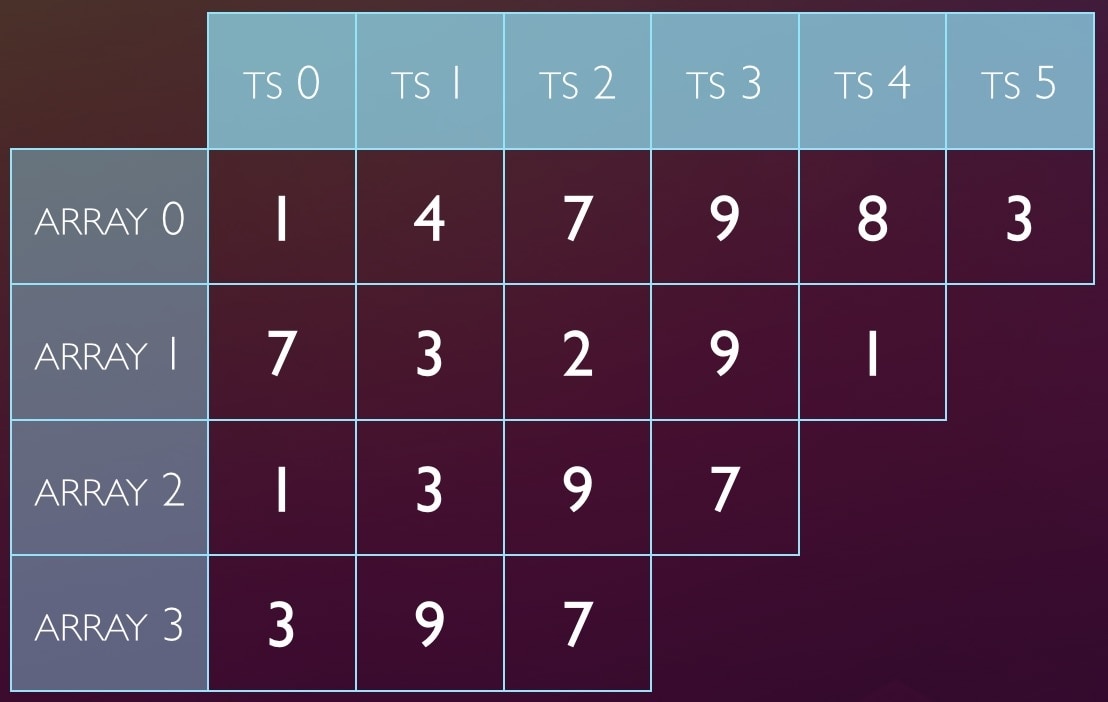
The sketch is several arrays of timestamps. Categories of events map to cells by hash and
modulus (using the checksum of the query digest). Each query will map to one cell
in each array, so with 4 arrays, it’s stored 4 places.
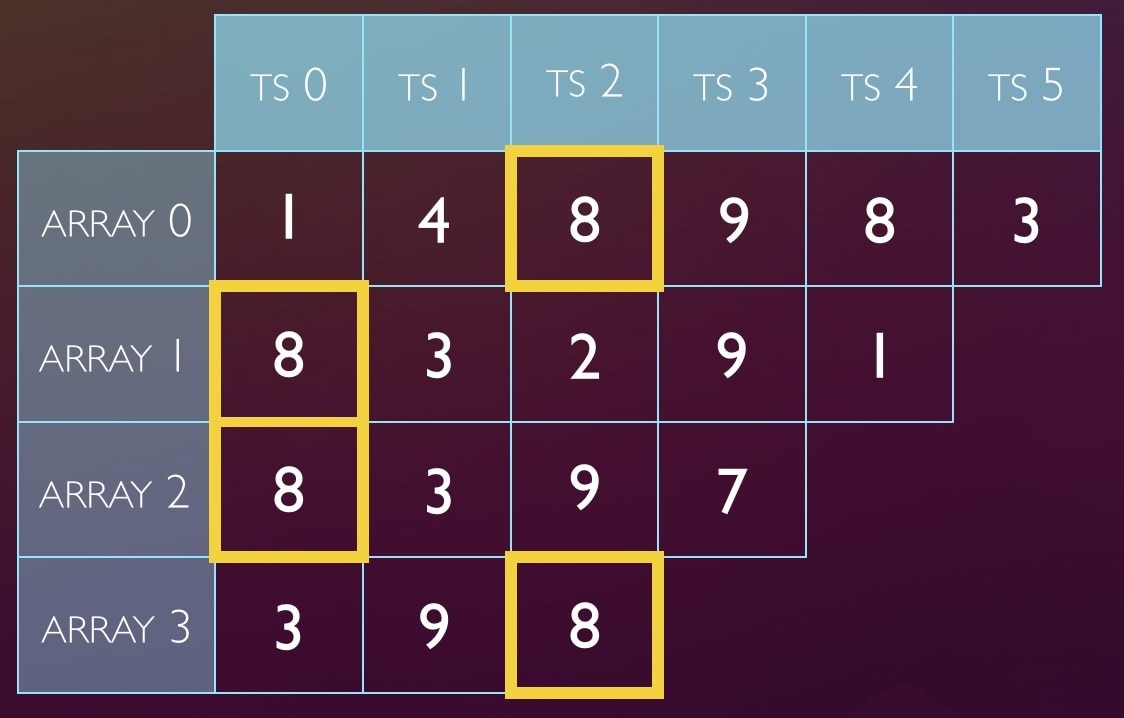
When we want to store a query’s timestamp, to remember that we’ve seen it, we’ll hash, modulus, and update every cell the query maps to. For example, to store ts=8 for a query that hashes to 20, first we ask: where are its values stored?
- 20 % 6 => index 2
- 20 % 5 => 0
- 20 % 4 => 0
- 20 % 3 => 2
So we update those cells with the value (timestamp) 8:
Later, we see a query that hashes to the value 13, and we need to look up the time we last saw a query in that category. We do the math again, and the indices are 1, 3, 1, 1. We look in those cells:

Now we choose the
smallest value seen. This is because
collisions are possible. In case of a collision, a later stored value may have overwritten some (or all!) of the values we stored last time we saw a query of category 13, and choosing the smallest value in the cells gives the most correct answer. (If there has been only a partial collision, it gives a completely correct answer).