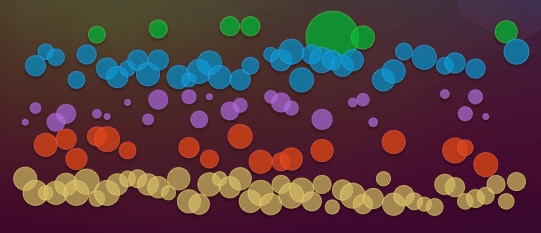
In a previous post, I explained that we observe rich and complex streams of events, something like the following multiplied by a million:
And our goal is to choose a sample of those events that can help understand what typical and/or important queries look like. There are a number of challenges to achieving this:
Rate limiting conflicts with biasing towards important queries
Rate limits overall conflict with sampling rates of each kind of query
Rare queries and frequent queries conflict
Efficiency and correctness are a constant tradeoff
The ideal approach is to sample a random event per time period per type of query, but our implementation wasn’t working as we wanted it to. We oversampled some kinds of queries, we couldn’t achieve the desired balance of sampling amongst different kinds, and we couldn’t prevent edge cases from causing performance problems, both in our agents and in our APIs.
The solution turned out to be an interesting combination of math, statistics, and approximate streaming algorithms (a sketch). That’s what I’ll focus on in this post.
I’ll mostly skip over the statistics, because that is mostly standard stuff you’d find in a college course and is covered well elsewhere. It’s enough to say the following: we found the best results by sampling within each type of query with a desired inter-sample duration, which is influenced by the overall sampling rate of all the types of queries together. This lets us balance our goals and avoid bad edge cases.
There’s only one interesting gotcha in the statistics worth mentioning: whether you’re using an exponential distribution, uniform, or some other function to compute the probability you should choose to sample any query you see, the function should be based on the time since the last seen event, not the time since the last sample selected.
This leads directly to the following approach:
For each query, first categorize it into a family or type. We do this with digesting and checksums, which we’ve written about elsewhere. The result is an integer that represents the query’s category.
Now we need to know how long it’s been since the last time we saw a query of that category.
Given the time delta between the last query in the category, and now, we calculate a probability we should select this query as a sample.
We generate a random number and compare it against the probability. If the random number is less than the probability, the answer is yes, and we select the sample.
There are a number of nuances–blacklisting, whitelisting, and so on–but that’s the gist of it.
The hard part, counterintuitively, is finding out how long it’s been since the last time we saw a query in the category. Why is that hard?
An exact answer requires remembering a timestamp for each category of queries.
This works fine for a lot of query workloads, but there are edge cases. These include: extremely large numbers of distinct query categories, as well as categories that are seen once and never again (and appear at high rates).
In those edge cases, it requires too much memory and CPU to remember every category’s last-seen time.
The solution to this seems like it should be some kind of forgetting over time, such as a cache with expiration, or an LRU. But forgetting leads to other problems which can be serious, especially oversampling and undersampling.
There are cases where forgetting or LRU expiration happens at very high rates when there’s high “category churn.”
So we needed an approximate, bounded, efficient way to remember most of the things most of the times, and create good behavior erring on the side of caution when there is forgetfulness.
That’s where the sketch comes in. A sketch is a compact, probabilistic data structure that trades off accuracy for resources. A bloom filter is one example of a sketch: it replaces an exact yes/no set membership question with an approximate probably/no question, at vastly cheaper cost.
The sketch we used is somewhat novel. We later found a published paper describing what we’d done, but at the time we were unaware of that. We were inspired by the Count-Min sketch, which counts approximately how many times events have been seen, per category. Instead of counting the number of events per category, we kept track of the last-seen timestamp per category.
It works a little like this (scaled down for simplicity):
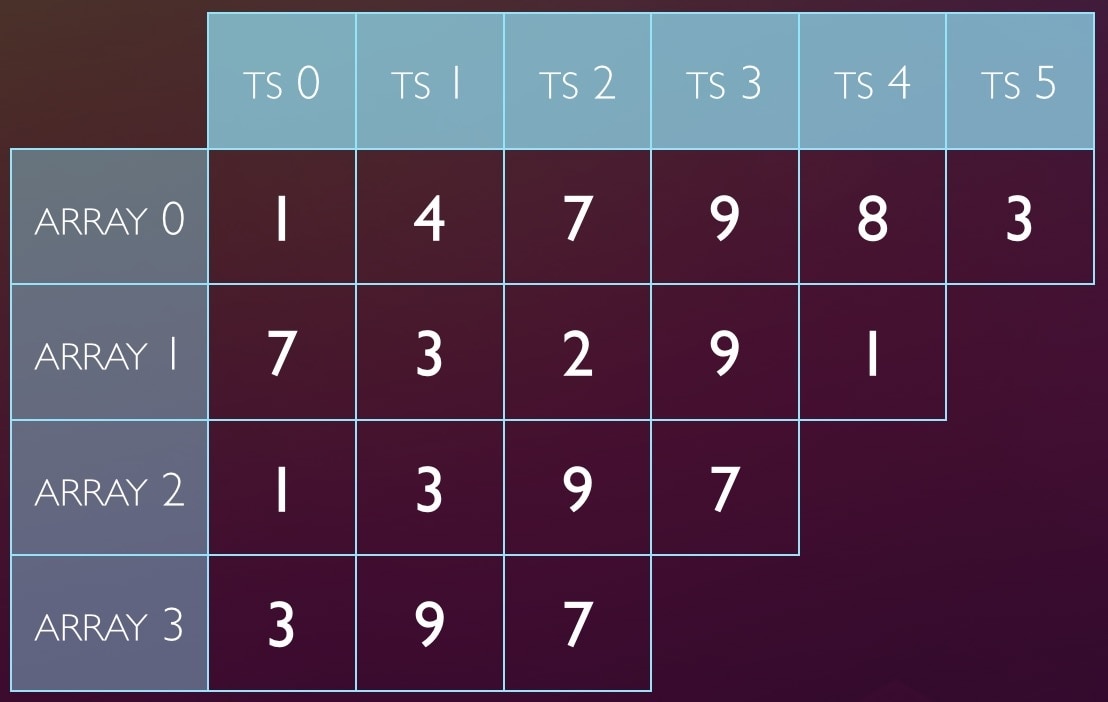
The sketch is several arrays of timestamps. Categories of events map to cells by hash and modulus (using the checksum of the query digest). Each query will map to one cell in each array, so with 4 arrays, it’s stored 4 places.
When we want to store a query’s timestamp, to remember that we’ve seen it, we’ll hash, modulus, and update every cell the query maps to. For example, to store ts=8 for a query that hashes to 20, first we ask: where are its values stored?
20 % 6 => index 2
20 % 5 => 0
20 % 4 => 0
20 % 3 => 2
So we update those cells with the value (timestamp) 8:
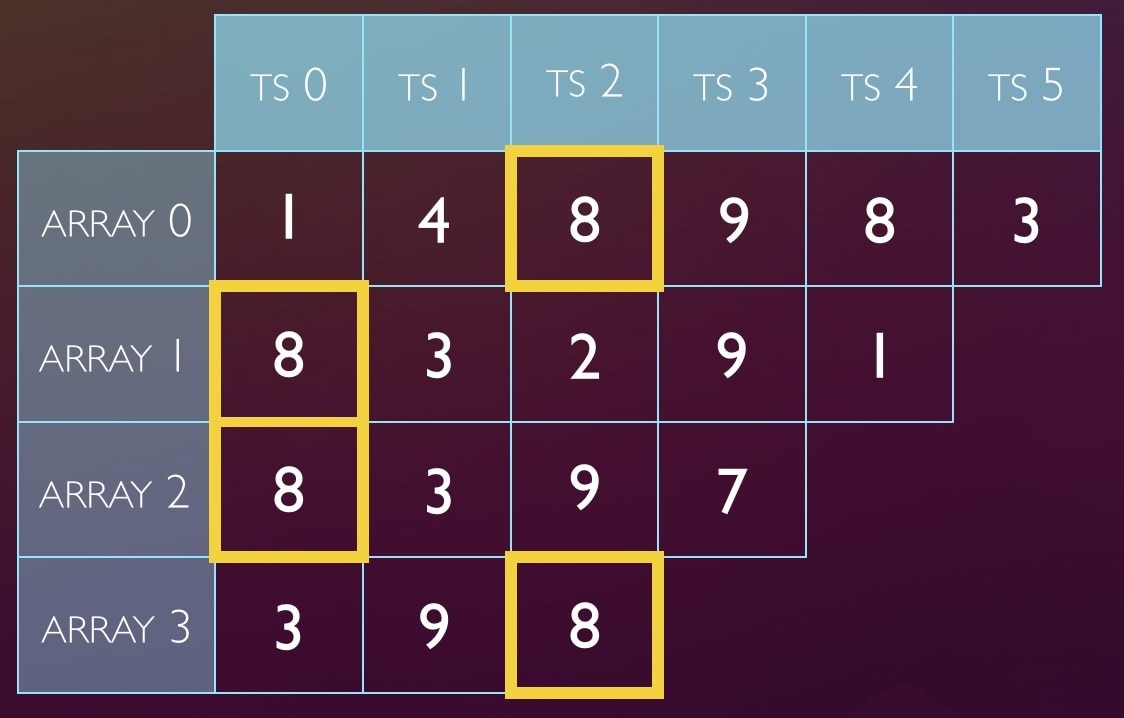
Later, we see a query that hashes to the value 13, and we need to look up the time we last saw a query in that category. We do the math again, and the indices are 1, 3, 1, 1. We look in those cells:
Now we choose the smallest value seen. This is because collisions are possible. In case of a collision, a later stored value may have overwritten some (or all!) of the values we stored last time we saw a query of category 13, and choosing the smallest value in the cells gives the most correct answer. (If there has been only a partial collision, it gives a completely correct answer).
It’s important to note that if there’s a complete collision, we err on the side of undersampling. This protects us and makes the worst-case actually in our favor.
And now we can compute the probability we should select a query.
As a result, we now have both metrics about the streams of queries, and samples of individual queries themselves:
Taken together, these are a much smaller set of data than the original queries themselves, yet they represent most of the essential characteristics of the queries. The result is unlike any other monitoring system I, personally, have seen. It gives unparalleled insight into what queries are doing.
How we actually use this in our application is we build views on top of the metrics, such as Top Queries, and from there we allow you to drill down and inspect the query categories in detail, including the samples. The following video demonstrates this capability:
Baron is a performance and scalability expert who participates in various database, open-source, and distributed systems communities. He has helped build and scale many large,…

 And our goal is to choose a sample of those events that can help understand what typical and/or important queries look like. There are a number of challenges to achieving this:
 The sketch is several arrays of timestamps. Categories of events map to cells by hash and
modulus (using the checksum of the query digest). Each query will map to one cell
in each array, so with 4 arrays, it’s stored 4 places.
When we want to store a query’s timestamp, to remember that we’ve seen it, we’ll hash, modulus, and update every cell the query maps to. For example, to store ts=8 for a query that hashes to 20, first we ask: where are its values stored?
The sketch is several arrays of timestamps. Categories of events map to cells by hash and
modulus (using the checksum of the query digest). Each query will map to one cell
in each array, so with 4 arrays, it’s stored 4 places.
When we want to store a query’s timestamp, to remember that we’ve seen it, we’ll hash, modulus, and update every cell the query maps to. For example, to store ts=8 for a query that hashes to 20, first we ask: where are its values stored?
 Later, we see a query that hashes to the value 13, and we need to look up the time we last saw a query in that category. We do the math again, and the indices are 1, 3, 1, 1. We look in those cells:
 Now we choose the smallest value seen. This is because collisions are possible. In case of a collision, a later stored value may have overwritten some (or all!) of the values we stored last time we saw a query of category 13, and choosing the smallest value in the cells gives the most correct answer. (If there has been only a partial collision, it gives a completely correct answer).
It’s important to note that if there’s a complete collision, we err on the side of undersampling. This protects us and makes the worst-case actually in our favor.
And now we can compute the probability we should select a query.
As a result, we now have both metrics about the streams of queries, and samples of individual queries themselves:
Now we choose the smallest value seen. This is because collisions are possible. In case of a collision, a later stored value may have overwritten some (or all!) of the values we stored last time we saw a query of category 13, and choosing the smallest value in the cells gives the most correct answer. (If there has been only a partial collision, it gives a completely correct answer).
It’s important to note that if there’s a complete collision, we err on the side of undersampling. This protects us and makes the worst-case actually in our favor.
And now we can compute the probability we should select a query.
As a result, we now have both metrics about the streams of queries, and samples of individual queries themselves:
 Taken together, these are a much smaller set of data than the original queries themselves, yet they represent most of the essential characteristics of the queries. The result is unlike any other monitoring system I, personally, have seen. It gives unparalleled insight into what queries are doing.
How we actually use this in our application is we build views on top of the metrics, such as Top Queries, and from there we allow you to drill down and inspect the query categories in detail, including the samples. The following video demonstrates this capability:
Taken together, these are a much smaller set of data than the original queries themselves, yet they represent most of the essential characteristics of the queries. The result is unlike any other monitoring system I, personally, have seen. It gives unparalleled insight into what queries are doing.
How we actually use this in our application is we build views on top of the metrics, such as Top Queries, and from there we allow you to drill down and inspect the query categories in detail, including the samples. The following video demonstrates this capability: