A lot of monitoring systems have a goal of end-to-end tracing, from “click to disk” or something similar. This is usually implemented by adding some kind of tracing information to requests. You can take a look at X-Trace or Zipkin for a couple of examples. The idea is that you can collect complete traces of the entire call tree a user request generates, even across services and through different subsystems, so a slow web page load can be blamed on an over-utilized disk somewhere.
I was at a database conference recently where this topic came up, and someone mentioned “blaming” resource usage on any of a variety of things. An example was blaming all disk I/O operations on tenants in a multi-tenant SaaS service. (My ears perked up, because
SolarWinds Database Performance Monitor (DPM) is such a service.)
SolarWinds DPM doesn’t do end-to-end tracing and it’s not a goal for us. However, the conversation made me pause and reexamine how I made the decision to consider that out-of-scope in the first place. As I retraced my thinking, three important points came up: what are the consequences of trying to do end-to-end integrated tracing? Is it possible? And if not, then what can you do instead?
As with anything, there are trade-offs, and our decision not to do these things has both good and bad sides.
Consequences of Doing End-To-End Tracing
One of the things that I’ve seen happen a lot in systems (such as APM systems) that offer end-to-end tracing is that the system’s architecture becomes built around that decision and nothing else can be considered. For example, such tools often lack visibility into system activity that is not user-initiated.
The classic example of this is the slow query that an APM system detects. A slow web page load is captured; the developer digs into the trace of the transaction and finds a slow query is the cause. But it makes no sense, because the slow query executes fast when the developer tries to run it. And it is a simple, well-indexed query. The unsolvable question, then, is why a single-row primary-key lookup took 10 seconds to execute instead of a millisecond.
Our customers see this all the time. The answer, if they’d had full visibility into the entire workload hitting the data tier, was that a cron job overloaded the server; or a backup job was running and the table was locked; or an analyst fired up Excel and executed a big BI query through the Excel connector to the database; or any of a hundred other scenarios. The monitoring system didn’t see any of those things, because it was only aware of database workload that came from instrumented code. This is typically missing a significant fraction of query traffic, especially the abusive query traffic.
In other words, systems that are built to do end-to-end tracing (or application-centric monitoring in general) often miss the bad queries that matter the most, while measuring things that aren’t a problem.
Is End-To-End Tracing Possible?
End-to-end tracing is possible in a lot of systems, but not always. In particular, it’s often impossible in databases. Databases are special in a lot of ways and this is just one of them.
The reason is that databases typically handle extremely hard workloads, and to get good performance they have to do smart things. One of the most common smart things is smart sharing of costs. In many cases a cost (such as a resource usage or a necessary wait) can be “pooled” across lots of actions, so on average each thing that’s doing work pays a lower cost.
A classic example is the write-ahead logging needed for durable commits in most databases. Most databases have some variant of group commit or a similar approach to avoid penalizing each transaction commit with its own set of waits for commit (mutex waits, memory copying, waiting for storage to ack an fsync() call, and so on).
Anytime a database does something smart to piggyback a bunch of costs together to reduce their impact, that cost can no longer be blamed on any one request. That fsync() call didn’t come from one user transaction that came from one web request, it came from a bunch of them. That disk IO operation can’t be blamed on one tenant, it’s a prefetch (readahead) that is grabbing data a lot of different tenants need.
Another thing that makes it hard or impossible to trace user actions to eventual consumption of resources is that a lot of work is deferred and done lazily in the background. Doing this offers additional opportunities to hide latency and combine multiple requests, driving efficiency and user responsiveness up significantly. Consider the InnoDB buffer pool flushing dirty pages to disk, for example. You can attack MySQL with a flood of INSERT queries and much of it will get buffered in memory, to be flushed out later when InnoDB’s background worker threads get a chance to do it optimally.
So the answer is, again, when it counts most, end-to-end tracing is often not possible.
This is just the reality of life in shared, high-performance, distributed systems. If we didn’t do these things that make systems hard to understand and troubleshoot, we wouldn’t get acceptable performance.
What’s The Alternative To End-To-End Tracing?
So if end-to-end isn’t possible when it’s most needed, and if trying to force the observable world into an end-to-end framework causes us to put blinders on our monitoring systems and make them miss the most vital parts of the system’s work, what can we do instead?
One alternative that we’ve developed, which is by no means the end-all and be-all, is statistical techniques. People often speak of “correlating metrics.” By this they usually mean aligning graphs and looking for similar shapes in different metrics. Correlation, though, is a mathematical technique. Regression analysis is a related approach that tries to determine a best-fit equation for the relationship (correlation) between sets of metrics.
It turns out this works very well in a lot of situations that matter in the real world. We may not be able to blame an individual user request for an individual I/O request, but we can often blame groups of similar user requests for groups of similar I/O requests. And because regression analysis is applicable to a lot of different kinds of things, this can be done across systems and in many other scenarios where no back trace signals are injected into requests. This allows lots of nice properties, such as being able to do ad-hoc analysis without needing to anticipate and prepare for a given kind of analysis (i.e. we don’t need to instrument things before we analyze them, we can analyze at will anything for which we have metrics). It also keeps data sizes manageable and makes “big data” analysis relatively cheap to do.
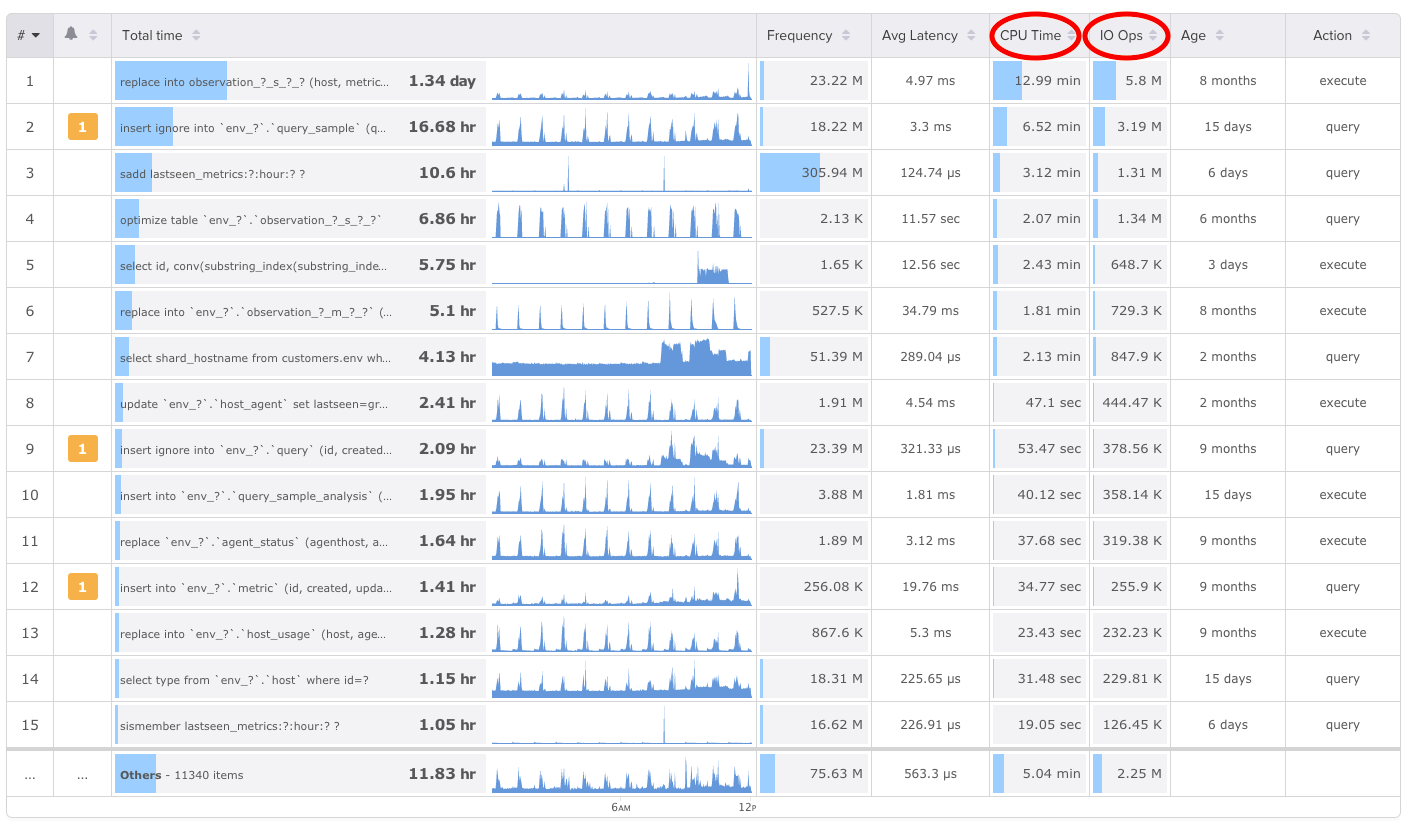
A concrete example is our Top Queries user interface, where we add columns for CPU, I/O, and other metrics:

These aren’t possible to measure and aggregate for individual queries, for the reasons I explained previously. But the statistical analysis is often a very good way to figure out the answer anyway.
 These aren’t possible to measure and aggregate for individual queries, for the reasons I explained previously. But the statistical analysis is often a very good way to figure out the answer anyway.


