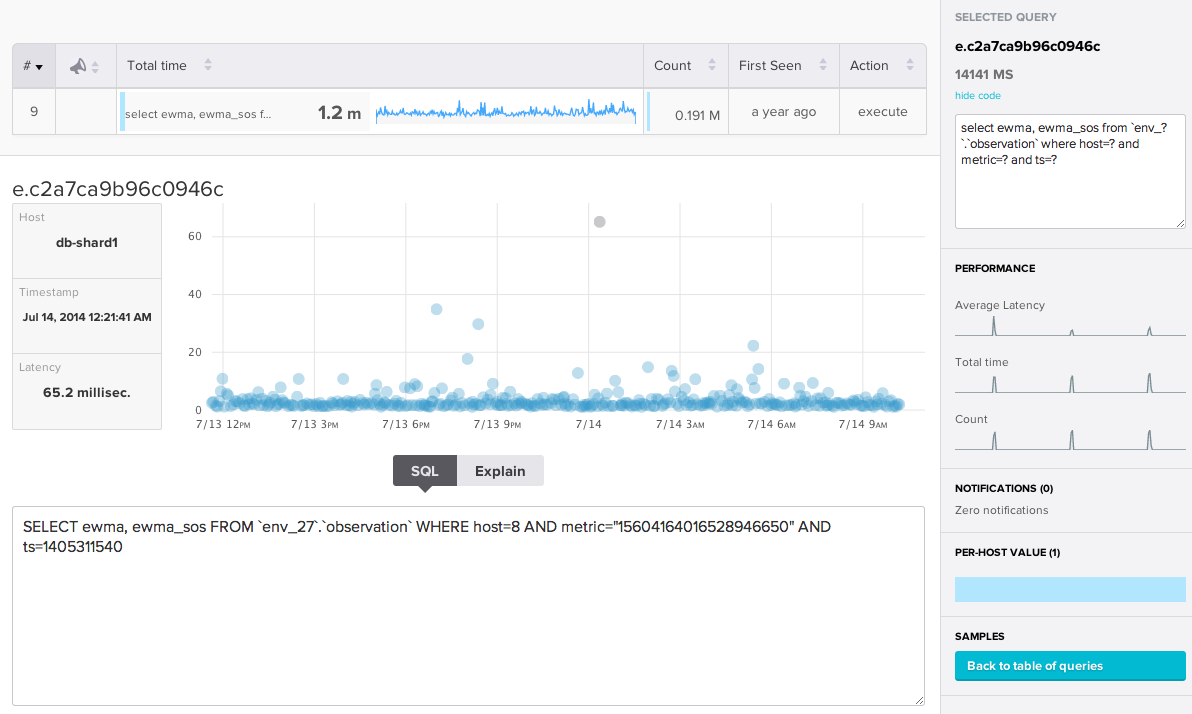
One of our most useful features is Top Queries, which allows users to examine various metrics for families of similar queries. Once a query family is selected, we can drill down into its query samples. Individual samples are shown on a scatterplot. Selecting individual samples will display its captured SQL, latency, errors, and more.
We collect query samples by decoding the MySQL protoco
l over TCP and extracting the query text. Not only that, we also capture errors, warnings, and more by inspecting traffic over the wire.
Until now, query samples excluded prepared statements. This is because prepared statements are not sent over the wire as strings of SQL text. Statement preparation and execution is quite different from regular query execution, but in the end we generate a good approximation of what the statement SQL would look like and display it on the samples page.

Regenerating the statement text happens in three steps. First, we grab the statement text from a
COM_STMT_PREPARE command sent from a client to the MySQL server. The server then sends the client a
COM_STMT_PREPARE response with a statement ID. When a statement is to be executed, the client sends a
COM_STMT_EXECUTE command to the server with the statement ID and its associated parameters. The parameters sent by the client are sent in the binary protocol format. When our agent sees a
COM_STMT_EXECUTE, it decodes the parameters and does a string replace in the original statement text to approximate the SQL query text.
Regenerating SQL from prepared statement executions is not perfect, but should be very good. We understand the argument types, escape strings and text when necessary, and represent parameters in hex when we have to. You’ll notice that the metric parameter is a quoted string, not a literal number. That’s because we actually send that parameter in ASCII format, as text. The protocol doesn’t lie!
Of course, we’re showing a sample of SQL that never executed as displayed, which is kind of disingenuous, isn’t it? But if you think about it for a moment, this is exactly what you get from sources like the slow query log, which also shows SQL that’s reconstructed from the prepared statement with parameters substituted in. The main difference is that the slow query log doesn’t tell you it’s showing you SQL that never actually executed, whereas here the Action column is
execute which tells you it’s a prepared statement, not a simple query.
Astute readers will have noticed the
EXPLAIN tab to the right of the SQL sample. That’s an upcoming feature. Stay tuned for more on that!
If you are interested in seeing how this can benefit your company, please click
here for a free trial.
 Regenerating the statement text happens in three steps. First, we grab the statement text from a


