Optimizing MySQL performance requires the ability to inspect production query traffic. If you’re not seeing your application’s production workload, you’re missing a vital part of the picture. In particular, there are lots of performance optimizations your systems might be doing that you’re not aware of. One of these is using prepared statements for queries.
What Are Prepared Statements?
A prepared statement is a SQL statement with parameter placeholders, which is sent to the database server and prepared for repeated execution. It’s a performance optimization and a security measure; it protects against attacks such as SQL injection, where an attacker hijacks unguarded string concatenation to produce malicious queries.
In MySQL, as well as in most databases, you first send the SQL to the server and ask for it to be prepared with placeholders for bind parameters. The server responds with a statement ID. You then send an
execute command to the server, passing it the statement ID and the parameters.
Go transparently prepares, executes, and closes prepared statements behind the scenes for you in some circumstances. Sometimes this isn’t obvious to the programmer.
A Real-Life Production Use Case
When prepared statements are being used as designed, they’re a win. Prepare once, execute many times. But if you’re preparing, executing once, and then closing the statement, you’re making three network round-trips to the server, which is a performance reduction, not an improvement.
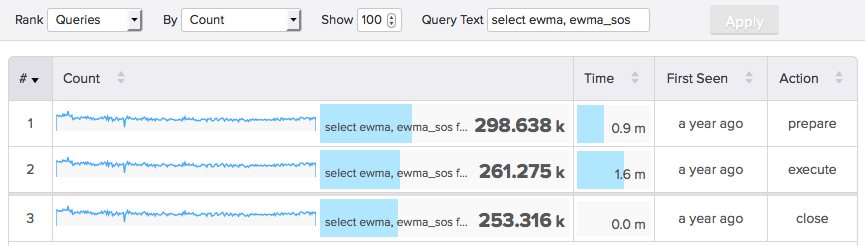
Yesterday I found just such an example in our central shard lookup database, which is a hotspot for our API traffic. Every API access first has to find the database server that stores the data for the customer environment being accessed. Here’s a screenshot of the query:
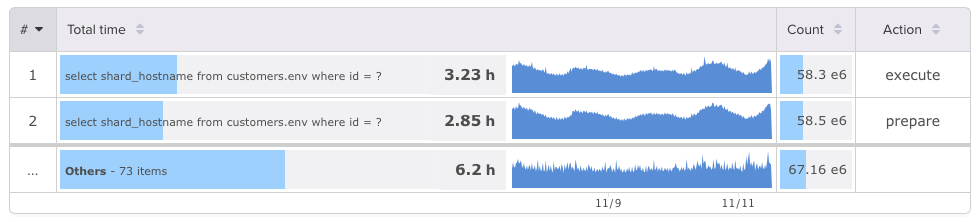
I’m ranking Top Queries by total time consumed, and limiting to the top two queries. You can see the top two queries appear to be the same query. But if you look at the rightmost column, you’ll notice the action – execute and prepare – is different.
The implication is clear. The top query on this database server is being essentially doubled in impact! Not only that, but if you look at the count, you can see it’s prepared more times than it’s executed, which means sometimes it’s prepared and then not even executed. This is an artifact of Go’s database/sql package and the way it treats prepared statements behind the scenes.
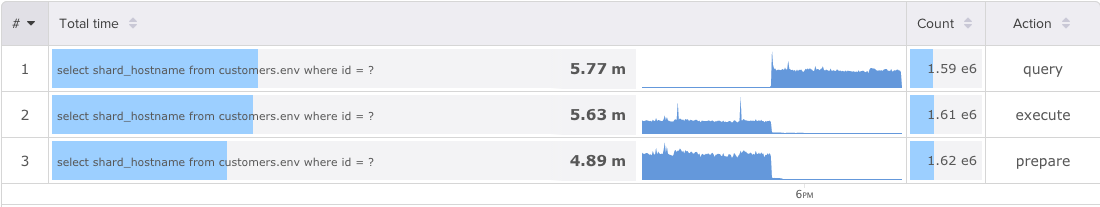
If we change from a prepared statement to a plaintext query here, we’ll reduce round-trips on the network and free up a lot of resources in the database server. Simple queries like this don’t benefit from being prepared. We’ll handle the security aspect of this query by validating input (which our API framework already does for us).
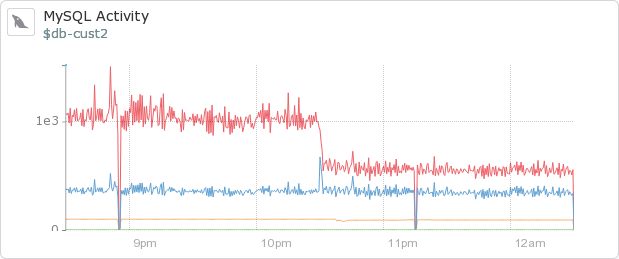
You can see the results of replacing the prepared statement below. Making this change resulted in nearly a 30% drop in load on our shard lookup server. The savings really cannot be overstated here; this query is run every time we read or write data from a customer’s environment, so this optimization will make a big difference.
Making Prepared Statements Visible
Prepared statement usage can be difficult to see in MySQL, making MySQL performance monitoring harder. There’s no internal instrumentation for it; you can’t see activity such as prepare, execute, and close distinct from just querying by sending plaintext SQL. There’s no way to get a list of all the prepared statements. In some versions of MySQL, you can’t see prepared statement usage with the Performance Schema statement tables. The slow query log also doesn’t show preparing or closing; it only shows executed statements, and it doesn’t give any indication that they were really prepared statement executions. They look just like any other query in the log.
In other words, database performance management is hard partially because databases don’t give you all the information needed.