We use exponentially weighted moving averages (EWMAs) quite a bit in a few algorithms. They’re one of the tricks everyone should have in their toolbox for cheaply approximating recent history of a time-series variable. We even wrote an
open-source implementation in Go.
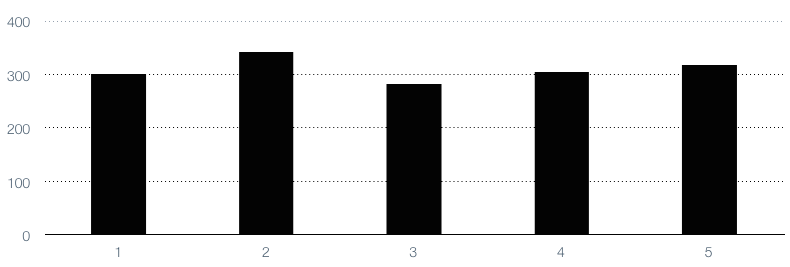
How do they work? That can be a little confusing, but I’ve found that pictures are a good way to explain it. Here’s the pictures I use. First, draw your time-series as a bar chart.
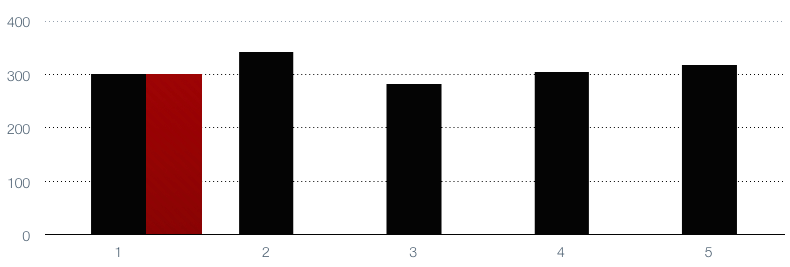
Now initialize your EWMA. There are several ways to do this, but one way is to just set it to the value of the first bar. We’ll color-code this one dark red.
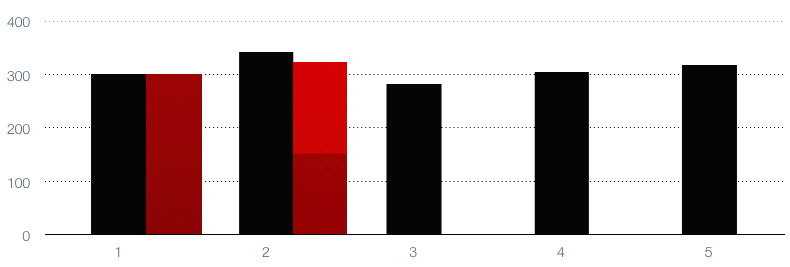
Now each further point in the time-series gets a combination of the current value of the EWMA, plus the new value, which we’ll color-code with a unique color each time. For simplicity, we’ll set the decay factor to 50%. This means each time we add a point, we’ll decay the existing EWMA by 50%, and add 50% of the new one to it. You can see that the new EWMA consists of half the first red EWMA, and half the second black value from the time-series. That means it’s closer to the second black value than it was previously, but it’s not all the way there:
Now just rinse and repeat. Notice the way that the EWMA tracks the general trend of the time-series value, but smooths out its extremes. Notice also that each value’s influence diminishes exponentially over time.

Are EWMAs the best thing since sliced bread? Well, they certainly have their uses, but obviously they don’t fit all possible cases.