
What is Telemetry Data?
OpenTelemetry is designed to help service designers and operators, such as DevOps, SREs, and other IT teams, collect, standardize, and streamline data about their systems using the OpenTelemetry Protocol (OTLP). Some of the most important types of data collected about service operations are logs, metrics, and traces, which can be defined as:- Logs are messages emitted by services and components describing some state or other useful information about a system. Logs include timestamps reflecting the point in time the message was generated. Logs are useful for collecting service-specific information, such as the start or end response to a request or a warning about an unexpected input.
- Metrics are aggregate, numeric values that describe the state of a system over some period. Metrics can describe utilizations, such as the percent of CPU utilization over the past five minutes, and rates, such as the number of service requests per minute. Metrics are sometimes used to measure the state of a service from the perspective of a user: for example, the average time to load a page. These metrics are used as service level indicators to help you understand how services are performing relative to business objectives.
- The third type of telemetry data, or signal, is distributed traces or simply traces. Tracing data involves tracking the path of service requests through a distributed system, such as a microservices architected application. Traces are especially important for isolating problems in services that require a series of requests to multiple services, which are often difficult to reproduce because conditions within a distributed system can be difficult to duplicate when debugging.
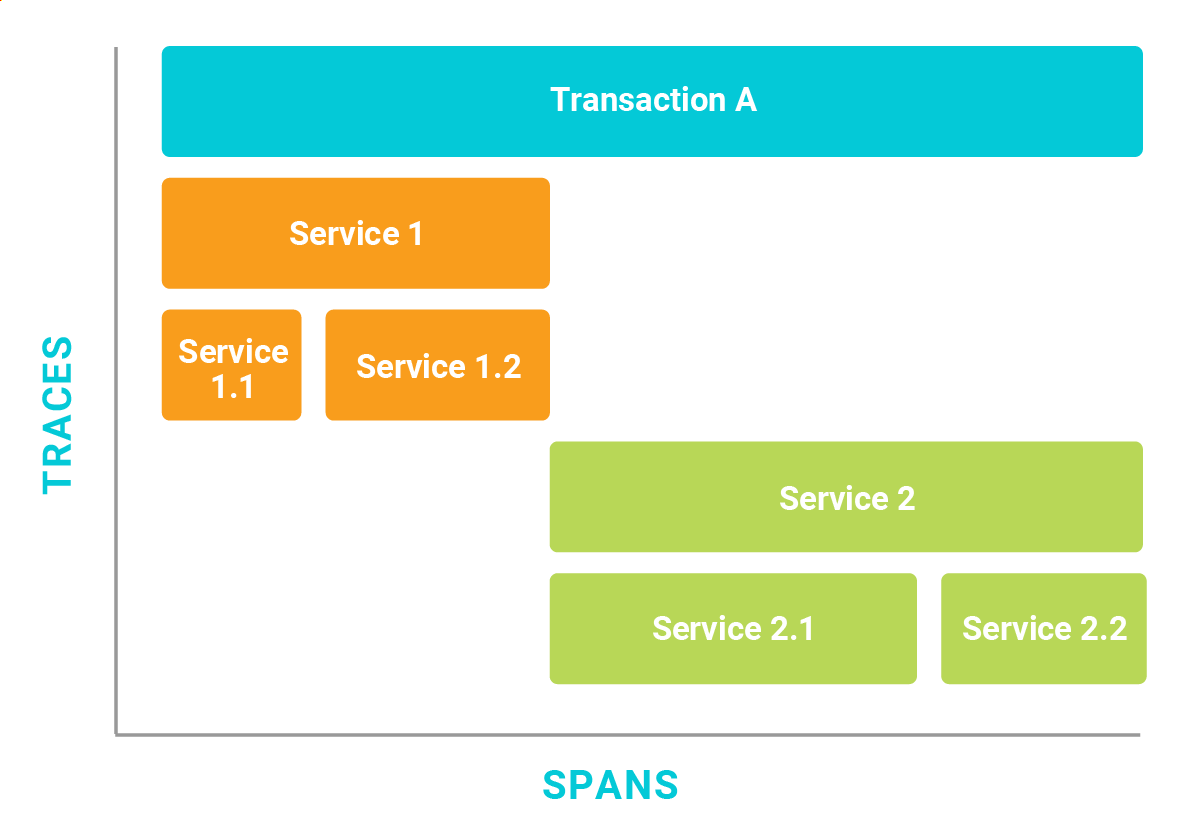
Figure 1. Traces are organized into spans, which show the distribution of time spent in services.
How Does OpenTelemetry Work?
OpenTelemetry includes several components, such as APIs used to add instrumentation code to programs to collect data. OpenTelemetry instrumentation is language-specific. For example, OpenTelemetry API includes instrumentation for commonly used libraries, such as programming languages like Python, Java, Javascript, and Golang. OpenTelemetry also provides language-specific software development kits (SDKs) used to implement additional functionality when needed. OpenTelemetry SDKs also provides automatic instrumentation of services and supports custom instrumentation. With auto-instrumentation, a developer can rapidly incorporate the collection of metrics, logs, and traces into a service. Customization can allow developers to add functionally not natively included in OpenTelemetry instrumentation. OpenTelemetry can use exporters, which are modules that transmit data using OTLP from instrumented services to a backend service where the data can be persisted and analyzed. Sending data directly from an exporter to a backend service can work well in development or in lightweight production environments, but in general, it’s a good practice to use a collector. OpenTelemetry collectors are services that run alongside instrumented services and receive data from exporters. The collector will then make sure that data is reliably delivered to the backend. Collectors are designed to handle efficient batching of data, retry failed transmissions, encrypt data, and perform related operations.Differences between OpenTelemetry and OpenTracing
Comparing OpenTelemetry and OpenTracing is like comparing peanut butter to a PB&J, as OpenTracing is actually one of the foundational open-source projects included in OpenTelemetry. Hosted by the Cloud Native Computing Foundation (CNCF), which is also responsible for Kubernetes and Prometheus, the OpenTelemetry project began as a way to address the need to collect telemetry data more efficiently across a wide range of services by merging the functionalities of the existing open-source projects OpenCensus and OpenTracing:- OpenTracing, as the name implies, collects, stores, and analyzes traces.
- OpenCensus is a library for traces and metrics that use the same metadata for both metrics and traces.
Benefits of Using OpenTelemetry
OpenTelemetry provides a single framework for working with telemetry data. This contrasts earlier application performance monitoring (APM) systems, which provided support for some view into data—metrics, traces, or logs—but not all data types. This is important because, in the past, application performance monitoring services often depended on vendor-specific monitoring solutions, which led to tool sprawl as teams searched for disparate analysis tools to solve specific pain points instead of centralizing performance insights into a single solution. For those of us who have struggled to correlate metrics collected in one system with log messages from another system, the ability to have standardized metrics in one place is key to better understanding the performance of the entire ecosystem and unlocks opportunities to streamline troubleshooting, automation, and alerting. By using OpenTelemetry, developers have a common framework that standardizes siloed telemetry data and reduces vendor lock-in, which can allow for a more integrated and holistic view of network performance, security issues, and more in an observability platform. Another important feature of OpenTelemetry is that it’s a vendor-neutral, open-source project, which brings two significant advantages:- No single vendor can make decisions that would undermine use of the standard by others.
- The project is governed by community members who use the standard in a wide array of use cases.