The Transformation of Distributed Tracing
Trends in application development—like DevOps—have caused organizations to investigate ways for their application deployments to become more portable and agile. At the same time, the dawn of the public cloud provided offerings like serverless functions and container services, which allow for new architectures. This newfound agility means applications built on top of a series of microservices can be deployed faster and in a less-coupled manner in comparison to previous methodologies where applications were tightly bound to the underlying infrastructure. This increase in deployment velocity doesn’t impede the ability of microservices to be fully vetted and tested, however. Given the smaller footprint of the application, it’s also far easier to maintain than a more monolithic application stack.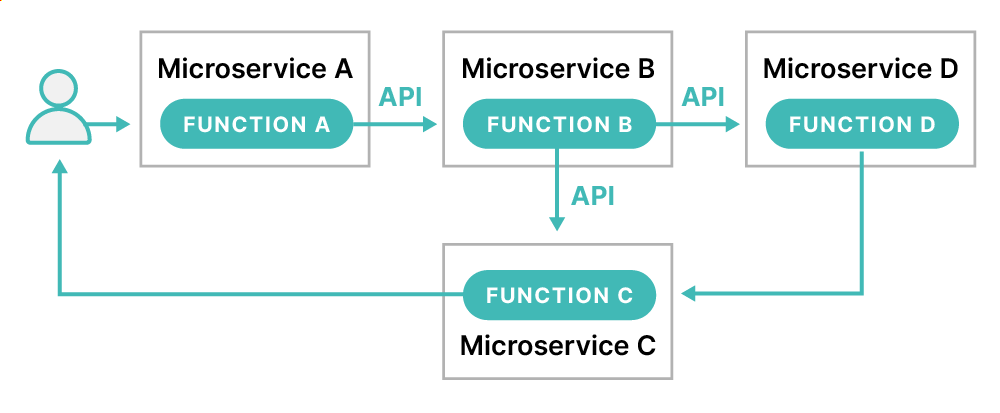
Figure 1 This diagram shows the microservices architecture
With the advent of microservices architectures as depicted in Figure 1, it isn’t surprising this new, quick, and efficient method would be developed for deployment. Beyond mere infrastructure changes, frameworks like Simple Object Access Protocol (SOAP) have been replaced with a series of REST API calls between application components. Though these services could be deployed to the same infrastructure, this didn’t provide the level of agility many development teams were seeking. This process also didn’t take advantage of cloud-native functionality. Modern applications are no longer tightly bound to the underlying hardware, nor are they collocated with other services. The solution to this issue came through using containers and container orchestration frameworks like Kubernetes. A container is a piece of software built to bundle an application and all its dependencies so it can run efficiently and independently from other components within the application stack. A container runs an individual service and may only exist for the life of a process. The isolation of the software within the container away from the infrastructure and operating system can also ensure the stability of the applications, regardless of the underlying infrastructure. The container can float between environments with ease. This continued nimbleness of containers ensures microservices exist in such a way they can quickly be created and destroyed with minimal interruption to the business. Containers facilitate the distributed outward growth many organizations experience today when deploying IT resources. As an additional comparison, virtual machines provide an abstract layer for the hardware containers by providing an abstract layer one step higher—the operating system.Wait, Isn’t Distributed Tracing Just Logging?
Sort of, but not really. Distributed tracing still logs information and traces data but in a different context. Any infrastructure component of a distributed topology can generate logs, but logging is for humans to consume and evaluate. This requires someone to consume and digest the contents of a log—or even multiple logs—to pinpoint where issues have occurred. If you’ve ever had to troubleshoot cluster logs for a Windows Server Failover Cluster or an open-source solution like Pacemaker, you’ll know this can be a long, arduous, and unfruitful process. Logging is usually a reactive mechanism, generating information based on a given event. For example, SQL Server logs certain events within its own error logs, such as successful database backup events. Though there are methods to disable this level of logging, SQL Server logs it by default out of the box. In this case, for the message to be logged, a database backup event must occur first. If the event doesn’t occur, the log message isn’t generated. Distributed tracing logs information, but it does it far differently.If It Isn’t Logging, What Is Distributed Tracing?
Distributed tracing is a method used to track requests or transmissions (which can be agnostic in nature) throughout a distributed topology of infrastructure components. At a high level, requests are usually tagged with a unique identifier, which facilitates end-to-end tracing of the transmission. This continued monitoring of the request allows an organization to have top-down visibility at essentially every level of the infrastructure stack and observability into latency throughout the entire application stack. This is different from logging because the transmission itself is tagged and cataloged as it travels throughout the entire ecosystem. This continued cataloging of metadata across containers and microservices and the transmission between them provides IT teams with far deeper insight into—and context for—the transmissions. This deeper visibility into the transmissions subsequently allows for greater accuracy and insight into where errors have occurred and allows engineers to debug bottlenecks, whether they’re in the Java application code or the database back end.Does Distributed Tracing Replace Logging Tools?
Keep in mind logging and distributed tracing can operate together in harmony. Logging is still the foundation of many IT departments, and performing one doesn’t mean you can’t perform the other. As organizations continue their journey into the realm of containers and microservices, distributed tracing offers up a complementary method to ensure infrastructure resiliency. Incidentally, as an IT professional of more than 20 years, I’d say having an abundance of information is significantly better than a lack of it. Having all the data available to assist in your troubleshooting efforts can get you to the root cause of performance issues, even for events you didn’t observe in real time. So don’t be afraid to use both logging and distributed tracing solutions when and where appropriate.How Does Distributed Tracing Work?
As previously mentioned, transmissions (or requests) are tagged. The tagging process begins in the application development, where libraries from the monitoring are added to the application. Let’s use a common example of an HTTP request. Once the application is appropriately tagged, requests continue to move through the various microservices. As they travel through the ecosystem, every operation performed on the requests is called a span. The initial request is considered the “parent span,” and every subsequent operation is a “child span.” Each child span also appends a unique trace ID in conjunction with the parent span identifier. Each span is a distinct marker of the request’s voyage. Each marker contains information about the microservice performing the work at that point in time. This information can include the following details:- Service name
- Contextual information about the event
- Tagging information, such as database host, session IDs, and HTTP methods
- Information in the event of failures
- Trace ID for each execution