When you're trying to understand your systems and why they behave as they do, one of the most powerful questions is "what changed?" or "what's different?" We've offered this capability for years with SolarWinds® and now we've added it to the more recent Explorer feature so you can interrogate your databases and discover what's new and different about them.
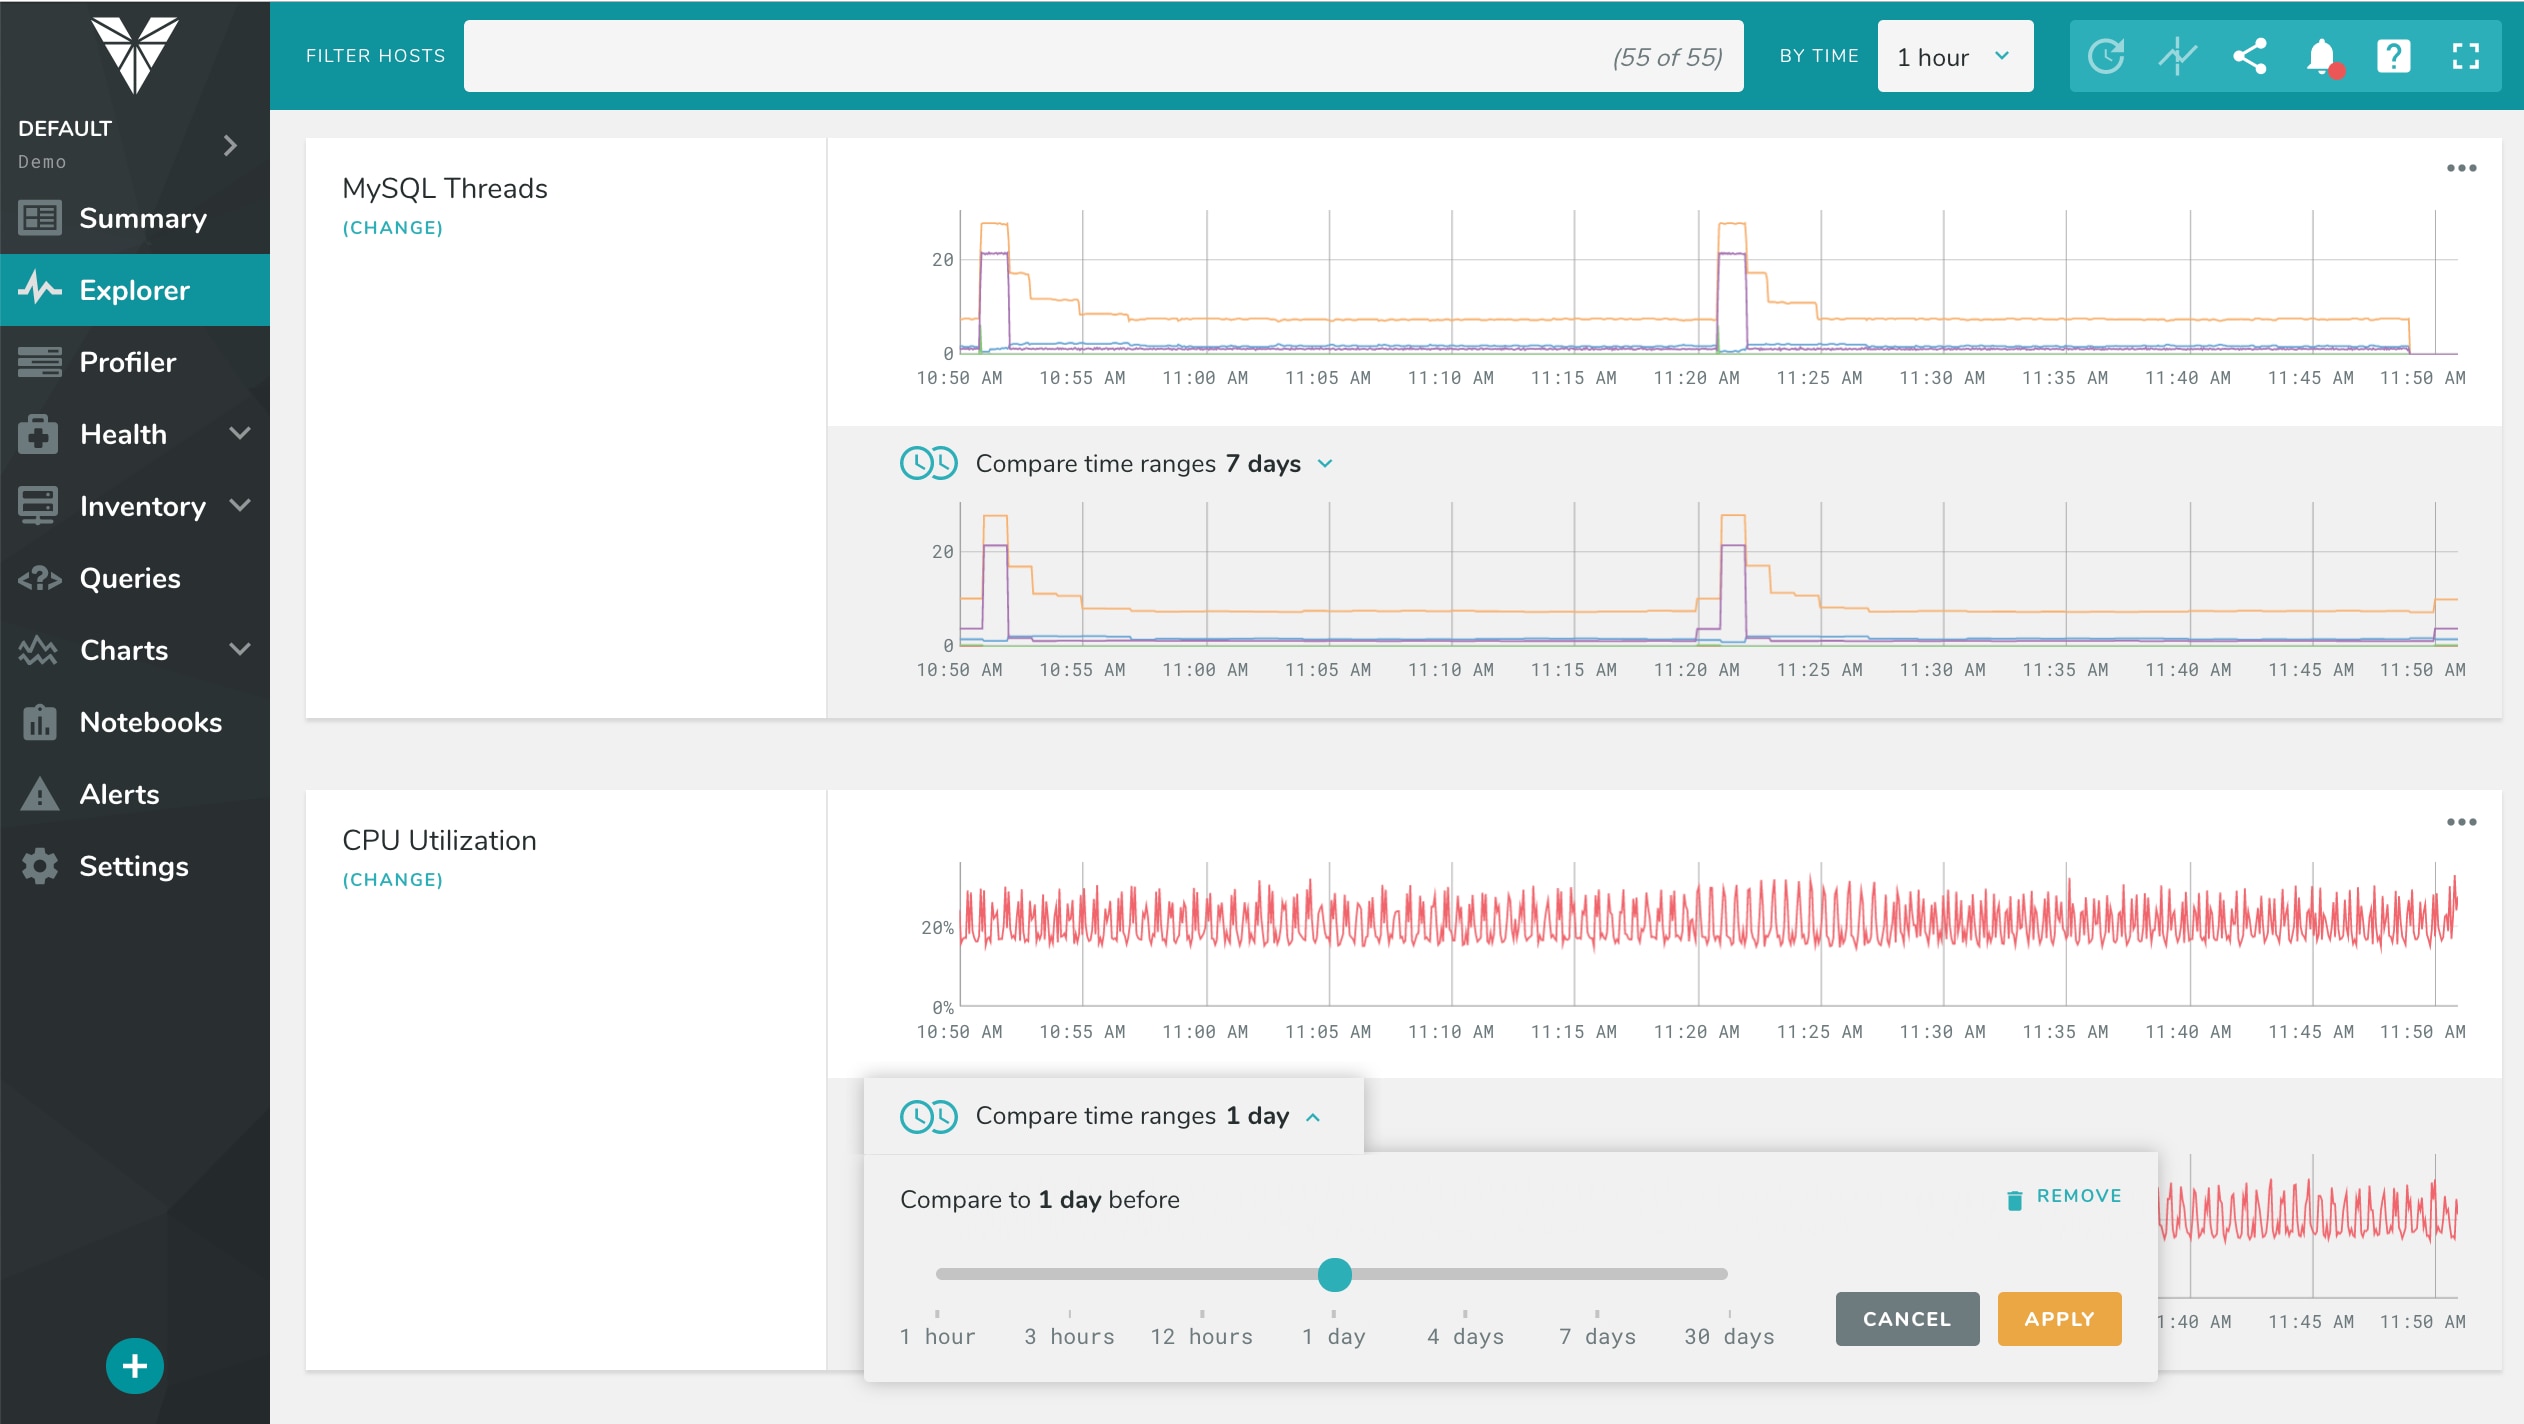
You can use the controls on an Explorer chart to add a time comparison within the chart. Adding this feature to Explorer lets you do two things you couldn't do previously with time comparisons:
- You can perform comparisons over time on any metrics in your systems, not just the ones you could view in the Profiler previously‚ such as top-ranked lists of MySQL/PostgreSQL/MongoDB/Redis queries.
- You can set the comparison interval differently in each chart. This also has the benefit of letting you compare a chart, top-list, or metrics over multiple time ranges: simply use the three-dots menu to duplicate a chart and you can adjust the comparison range differently in each one.
Here's a gif demonstrating how to add historical comparisons, as well as adding a new chart into the Explorer and then adding a second time range to it:
When are time range comparisons helpful? Our customers tell us this simple-but-useful feature comes up frequently in their daily work:
- When you release any change to your app or systems—for example, releasing a new version of your app, changing a configuration setting, or adding an index to a table. A great "deploy confidence" procedure is to do a before-and-after comparison of the database's query workload, to see if the release introduced any important new queries.
- When your databases are having performance problems and you're not sure what changed, you can compare current queries against the queries at a time when the databases weren't struggling, and see what's different in the query workload.
- When someone suspects a change—is the database behaving any differently?—you can answer it quickly, and narrow down the troubleshooting work by helping eliminate suspicion if the database isn't experiencing anything unusual, or focus efforts on the database if it is.
Explorer time comparison is available today to 100% of users, even those who aren't sure if they believe in life after love. We got you, babe.