Databases have a lot of jargon, and cardinality is one of those words experienced people tend to forget they didn’t know once upon a time. But if you don’t know it—and it takes a while to get comfortable with cardinality—it’s super confusing when the DBA just drops it into the middle of a sentence without slowing down. Fear not: I’ve got you, as they say.
Cardinality’s official, non-database dictionary definition is mathematical: the number of values in a set. When applied to databases, the meaning is a bit different: it’s the number of distinct values in a table column relative to the number of rows in the table. Repeated values in the column don’t count.
With this definition of database cardinality in mind, it can mean two things in practice. For our purposes, one matters a lot more than the other. Let’s explore the simple definition first and then dig into why cardinality matters for query performance.
What Is Cardinality in Data Modeling?
The first meaning of cardinality is when you’re designing the database—what’s called data modeling. In this sense, cardinality means whether a relationship is one-to-one, many-to-one, or many-to-many. So you’re really talking about the relationship cardinality.
Watch the on-demand webcast:How to Conduct a Database Design Review
High and Low Database Cardinality Definition
The more important definition of cardinality for query performance is data cardinality. This is all about how many distinct values are in a column.
We usually don’t talk about cardinality as a number, though. It’s more common to simply talk about “high” and “low” cardinality. A lot of distinct values is high cardinality; a lot of repeated values is low cardinality.
Cardinality in Database Example
Picture a product description table in an e-commerce database:
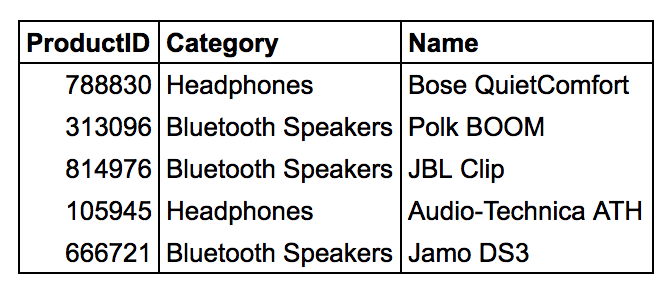
The ProductID column is going to have high cardinality because it’s probably the primary key of the table, so it’s totally unique. If there’s a thousand rows in the table, there’ll be a thousand different ProductID values.
The Category column will have a lot of repetition, and it’ll have low or medium cardinality: maybe 50 or 100 different Category values.
Name probably has high cardinality, unless there’s more to this table than meets the eye (such as multiple rows for different product colors and other variations).
Cardinality in Time Series Databases
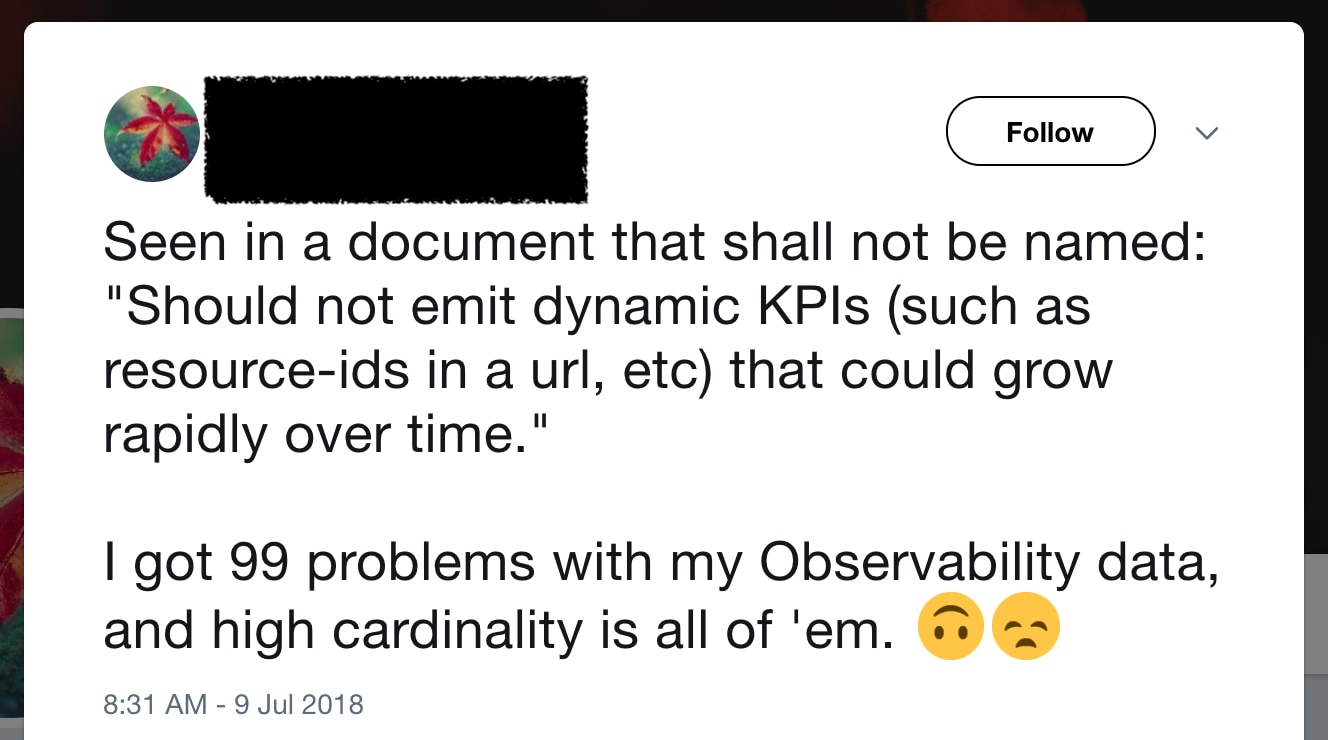
In addition to cardinality in databases, I also want to help simplify what it means to use cardinality in monitoring. If you’ve seen discussions of “high-cardinality dimensions” or “observability requires support for high-cardinality fields,” this is what we’re talking about. So what does it mean?
Generally, this refers to the number of series in a time series database. A time series is a labeled set of values over time, stored as (timestamp, number) pairs. So, for example, you might measure CPU utilization and store it in a time series database:
os.cpu.util = [(5:31, 82%), (5:32, 75%), (5:33, 83%)...]
This data model is the canonical starting point for most monitoring products. But it doesn’t contain a lot of richness: what if I have a lot of servers and want to know the average CPU utilization of, say, database servers versus web servers? How can I filter one kind versus the other? To solve this problem, many monitoring systems nowadays support tags with extra information. One way to conceptualize this is to make those data points N-dimensional instead of simply timestamps and numbers:
os.cpu.util = [(5:31, 82%, role=web), (5:32, 75%, role=web), (5:33, 83%, role=web)...]
This looks wasteful, doesn’t it? We’ve repeated “role=web” again and again, and we should be able to do it just once. Plus, most time series software typically tries to avoid N-dimensional storage because time-value pairs can be encoded efficiently—it’s much harder to build a database capable of storing these arbitrary name=value tags.
The typical time series monitoring software solves this by storing the tags with the series identifier, making it part of the identifier:
(name=os.cpu.util,role=web) = [(5:31, 82%), (5:32, 75%), (5:33, 83%)...]
But what if “role” changes over time? What if it’s not constant, even within a single server? Most existing time series software says, well, it’ll become a new series when a tag changes because the tag is part of the series identifier:
(name=os.cpu.util,role=web) = [(5:31, 82%), (5:32, 75%)] (name=os.cpu.util,role=db) = [(5:33, 83%)...]
When people talk about cardinality in monitoring and how it’s hard to handle high-cardinality dimensions, they’re basically talking about how many distinct combinations of tags there are, and thus the number of series. And there can be lots of tags, so there can be lots of combinations!
(name=os.cpu.util,role=web, datacenter=us-east1, ami=ami-5256b825, …) = [...]
Most of these tags are pretty static, but when one of the tags has high cardinality, it simply explodes the number of combinations of tags. A tag with medium cardinality, for example, could be a build identifier for a deployment artifact. High-cardinality tags would come from the workload itself: customer identifier. Session ID. Request ID. Remote IP address. That type of thing.
Most time series databases instantly crumble under these workloads because their data model and storage engine are optimized for storing points efficiently and aren’t optimized for lots of series. For example:
Some of the more modern time series databases are built for many series. InfluxDB is an example. They’ve put a lot of work into handling tons of series, and they have quite a bit in their documentation about how InfluxDB deals with high cardinality.
But this is all about storage and whether the time series database can handle storing lots of series. What about retrieval? Can the time series database handle arbitrary queries against its data without regard to the nature and cardinality?
Typical time series databases can’t because they’re built around—and designed to operate within—the constraints of series. Think of a series as a “lane” of data: typical time series databases can only swim within the lane when they run a query, and they can’t swim perpendicular to the lanes. This is because a series is a pre-aggregation of the original source data. The series identifier is what all the values in the series have in common, and when the data was serialized (so to speak), it was aggregated around the series identifier at write time. The series ID has the same function as GROUP BY fields in a SQL database. But unlike using GROUP BY in SQL, typical time series databases do the GROUP BY when they ingest the data. And once grouped, the data can’t ever be ungrouped again.
Some databases—again, InfluxDB, for example—have both tags-as-series-identifier and multidimensional values. It’s sort of like this:
(name=os.cpu.util,role=web) = [(5:31, 82%, build_id=ZpPZ5khe)...]
But some of these tags are more special than others, so to speak. InfluxDB talks about which tags are “indexed”—which ones are part of the series ID and pre-grouped-by. In general, software with special and non-special tags like this usually has some restriction around operations on it: maybe you can’t filter by some tags, or maybe you can’t group by some tags, or so on. Druid is in the same vein as InfluxDB in this regard.
And this is where the focus of products and technologies suddenly becomes clear. Traditional time series software was designed with an internal-facing SysAdmin worldview in mind, where we inspected our own systems/servers and cardinality was naturally low. This is where RRD files came from. We looked inward to figure out whether our systems were working.
But now, in the age of observability, forward-thinking engineers (and vendors) are focused on measuring and understanding the workload or events. Workload (query/event) measurements are very high-cardinality data sets by nature.
What’s the job of a database? To run queries. How do you know if it’s working? Measure whether the queries are successful, fast, and correct! Don’t look at the CPU and disk utilization—it’s the wrong place to look.
So when someone mentions high cardinality in monitoring, why it’s important, and why it’s hard, what does it mean? I’ll summarize:
- Workload or event data is the right way to measure customers’ actions and experiences.
- System workload is many-dimensional data, not just one-dimensional values over time, and it has very high cardinality.
- Traditional time series databases were designed with a system-centric worldview and thus weren’t built to store or query workload data.
Using traditional tools to measure, inspect, and troubleshoot customers’ experiences is basically impossible because of pre-aggregation and cardinality limitations, and this leads engineers to focus on what the tool can offer them—which is often the wrong place to look.
Importance of Cardinality for Database Performance
Cardinality has a big impact on database performance because it influences the query execution plan. The planner will examine column statistics and use them to figure out how many values a query is likely to match, among other things. Depending on what it finds, it might use different query execution plans to improve database performance. But this is a topic for a different blog post because it takes a bit of work to explain.
So next time someone drops “high cardinality” into a sentence without pausing, you know they really mean “a lot of different values.”