SQL Server monitoring is continuous collection and analysis of usage, performance, and event metrics for Microsoft SQL Server. It’s the first step in optimizing performance for applications that depend on your data platform.
Highly effective monitoring gives a bird’s-eye view of your entire data estate. It also provides the deep analytics necessary to perform root cause analysis on the most challenging performance problems. Baselines and historical data help measure and highlight performance trends. A comprehensive monitoring solution will also include extensive options for proactive alerting and automated remediation of familiar performance problems.
The most beneficial performance monitoring delivers the means to measure and improve performance using a unified SQL Server monitoring solution.
- Why Monitor SQL Server
- SQL Server Performance Monitoring Benefits
- Automating SQL Server Performance Monitoring
- SQL Server Performance Monitoring Best Practices
- How to Choose a SQL Server Performance Monitoring Solution
- Evaluating SQL Server Performance Monitoring Tools
- What to Monitor in SQL Server
- Examples of Common SQL Server Performance Monitoring Insights
- How SolarWinds SQL Sentry Can Help
Why Monitor SQL Server?
We cannot improve where we haven’t measured. Failing to monitor SQL Server performance often finds us unprepared when trying to solve urgent problems. Many performance challenges require replicating a scenario to pinpoint the root cause of a performance problem. Replicating a particular scenario from scratch is costly and may prove to be impossible.
3 Benefits of Monitoring SQL Server Performance
-
Reduce performance-related incidents and outages
Performance related incidents are extremely costly and can affect the ROI for your business. Proactive SQL Server performance monitoring leads to fewer performance-related issues and fewer tickets to resolve. Free your team to focus on optimizing overall data platform performance and supporting other lines of business rather than constantly fighting fires.
-
Lower infrastructure cost
Maximize infrastructure investments by ensuring applications achieve the best possible performance within service and hardware boundaries. When you need to upgrade cloud services or hardware, you can do so with confidence that the decision is not wasteful.
-
Manage risk
Continuously monitoring performance to help keep your data platform running smoothly reduces the risk of downtime. Downtime costs your business heavily in lost productivity and places the data platform team into a harmful reactive posture.
Automated SQL Server Performance Monitoring
Manually monitoring SQL Server is tedious. You could spend hours each day gathering data from performance counters, event logs, and DMVs across potentially hundreds of servers and instances. This is before even considering how you might store and analyze historical information.
You’ll still need to format and present data in a logical and consumable fashion after collection. You now have even less time for solving real problems proactively.
DBAs who try to approach performance monitoring this way often abandon daily monitoring altogether. The result is a perpetual cycle of reactive troubleshooting. This reactive stance reduces performance over the long term and costs the business in lost revenue and productivity. Reactive posture places the data platform into an unpredictable state and forces DBAs to live with unyielding stress response.
SQL Server Performance Monitoring Best Practices
4 Common Performance Monitoring Pitfalls
-
Too much data
Too much data leaves you confused as you sift through mountains of irrelevant information. Your monitoring solution should provide rich and timely detail of actionable performance information.
-
Not enough detail
Too little information leads to incorrect or incomplete conclusions, which can be very expensive. Imagine investing large amounts of time and capital in an effort to solve a problem that was never truly a problem. Holistic performance monitoring gives you the full picture of performance to guide you to accurate conclusions.
-
High observer overhead
A monitoring engine that creates too much overhead adds to your problem rather than helping solve the problem. It defeats the purpose of monitoring, forcing you to trade resources for visibility.
-
DIY solution technical debt
DIY solutions cause ongoing maintenance headaches. Problems arise when you don’t remember who built the solution, or the person who built it can’t maintain it indefinitely. In many cases, the architect wasn’t an expert in performance monitoring, which can result in glaring functionality shortcomings.
Choosing a SQL Server Monitoring Solution
The Truth About Performance Monitoring Options
There are several options available to provide SQL Server performance monitoring. A primary question to answer will be whether to buy a solution or build a solution. We’re in the age of cloud computing, and SQL Server can be delivered in many ways. There are native monitoring tools available, yet the recommendation is still buy or build. The reason for this is the high probability of having more than one method for hosting SQL Server workloads in your enterprise. Effectively utilizing the available native monitoring tools across multiple public clouds, hybrid data centers, PaaS, virtualized, and bare metal servers is no longer feasible.
A decision to rely on native performance monitoring tools might have your team constantly reviewing performance data across several or all of the following:
- Dynamic Management Views (DMVs)
- SQL Trace
- Extended Events
- Windows System Monitor (perfmon)
- Windows Event Logs
- VMware vCenter
- VMware vRealize (vRops)
- Azure Monitor
- AWS CloudWatch
- Google Stackdriver
The above list doesn’t approach running SQL Server on Linux or in containers, which add several more. It also doesn’t cover additional performance monitoring needs for the data platform such as ETL/ELT and analytics systems like SQL Server Analysis Services.
There are so many relevant sources of performance data spread across disconnected native tools. The options boil down to buy vs. build in all but the simplest deployments.
The Build Option
A commitment to building your own performance monitoring solution isn’t generally advisable. A successful build will require time and resources to create and maintain a solution that consistently delivers high value for years to come.
The option you choose should work for you in several ways:
- Collect and aggregate relevant and actionable metrics
- Understand your data platform as a full stack including hybrid, multi-cloud, virtualization, and host operating systems
- Analyze current and historical SQL Server database performance intuitively
- Alert on important events for your data platform and applications providing extensive alerting customization options
- Scale with your environment now and for the future
- Maintain a low resource footprint to avoid observer overhead
In answering the buy vs. build question, concern over whether your team can create a system is likely unwarranted. Your engineers and data pros are quite capable of creating a system for SQL Server monitoring.
A more pressing concern should be over whether building and maintaining a monitoring system is a priority for your business. Realizing exceptional value from your solution will require consistent improvement and maintenance.
For reference, SentryOne maintains a growing team of 70+ full-stack engineers, product managers, technical support, escalation engineers, and customer success engineers. Microsoft Data Platform MVP, PASS co-founder, and SolarWinds Head Geek Kevin Kline recalls his experience with building a SQL Server monitoring solution. He said, “I did my own monitoring as a DBA but reached a point where it was too much. The test matrix got too big due to new versions, new operating systems, etc.”
The Buy Option
A decision to buy commercial SQL Server monitoring should be accompanied with a commitment to properly evaluate your options. If the evaluation is too much for your team to take on, be sure to ask if the vendor can provide evaluation assistance.
The choice to buy instead of build leads to the next logical question. Which one? Let’s revisit a summary list of how monitoring should work for us:
- Automatically collect and aggregate metrics
- View the full stack of your data platform
- Intuitive analysis of current and historical performance
- Extensive and customizable alerting options
- Scale efficiently to any size environment
- Prioritizes low observer overhead
There are several third-party options for monitoring SQL Server. They all have different features aimed at filling the needs in the above list and more. All of them claim to fill those needs better than the others. There’s only one true way to determine the best fit for your team and environment: conduct an extensive trial of the solutions you’re interested in.
4 Key Tasks for Evaluating SQL Server Performance Monitoring Tools
Make sure you cover all the bases during your evaluation by completing these important tasks.
- Measure observer overhead on monitored systems
- Monitor a production or replicated production workload
- Baseline a workload and look for degrading performance trends
- Create a support caseand evaluate your support experience
The SolarWinds Evaluation Approach
The mission and purpose of SolarWinds® SQL Sentry® revolves around improving quality of life for Microsoft data professionals and their customers. We believe our SQL Server monitoring solution is a perfect fit for any data platform built on Microsoft SQL Server. At the same time, we encourage our clients to fully evaluate our solution alongside other options of interest. If SQL Sentry is right for you and you conduct a complete evaluation, we know you’ll want to choose us as your partner in performance. For customers with large complicated environments we’ll invest heavily to help you. You’ll conduct the evaluation through a structured Proof of Concept alongside a team of our technical experts.
What to Monitor for SQL Server
Microsoft SQL Server is complex. If you’re just getting started with it, it could seem less complicated than it is. On the surface, you design and build databases. You perform CRUD operations. You apply an indexing strategy to improve said CRUD operations. The perception of simplicity will fade as you experience errors, outages, or delays that aren’t easily explainable.
Your best defense against under-performing databases is monitoring your entire data platform stack. Monitoring should include SQL Server and hypervisor hosts to stretch infrastructure in public, private, and hybrid cloud. What about analytics platforms such as SQL Server Analysis Services (SSAS) or big data platforms such as Azure Synapse Analytics? Cloud platforms like Azure SQL Database and Amazon Web Services RDS for SQL Server are also a part of your overall data estate. All of these can be continuously monitored—and should be. If you’re only looking at full SQL Server instances, you have no visibility into other areas of your data platform.
SQL Server Components
Knowing a little more about SQL Server architecture will help you understand what to monitor and why. This is not meant to cover the architecture extensively, but it should be enough to follow a conversation.
The SQL Server database engine is composed of four basic components. At the time of this writing, this is the case regardless of how SQL Server is delivered or hosted. You should be able to count on these components being active regardless of your method(s) of deployment for SQL Server. They may not be exposed to administrators in every case, but they’ll be there making SQL Server go.
Protocol or Network
This part lets us connect clients to SQL Server. We monitor network traffic to know when network-related issues are interfering with performance.
We also monitor network activity to look for signs of problems related to how applications or users are interacting with the server. One frightening example of this might be a distributed denial of service attack on a website dependent on the database server.
SQL Server supports different protocols and communicates over the network using Tabular Data Stream (TDS). In most practical cases you’ll deal with SQL Server connectivity using TCP/IP. Other supported protocols are Named Pipes and Shared Memory. Shared Memory protocol can only be used for clients running on the same host as the SQL Server instance. Named Pipes is rarely used. It works for local area networks (LANs) and becomes less efficient the more distributed the LAN gets.
Storage Engine
The SQL Server storage engine handles things like transactions, file management, and access to different database objects. Without the storage engine, the database couldn’t be transactional or concurrent. It also wouldn’t be able to persist data.
Metrics we monitor for the storage engine include storage capacity and performance, file access, and storage allocation.
Query Processor
The query processor processes and executes queries. It’s a complicated piece of engineering, but at a high level, its purpose is succinct. It parses, plans, and executes the queries applications send to SQL Server.
We monitor query processor activity by analyzing queries being processed, how long they take, and what resources they use. It’s also very beneficial to collect the query plans used to execute queries and the statistics used to generate the query plans.
SQLOS
SQLOS refers to the portion of SQL Server that resembles an operating system. The functions that make up SQLOS are numerous. Other SQL Server components interact with SQLOS through an API.
SQLOS takes care of things like CPU scheduling, threading, memory management, logical I/O, and background processes. Some things background processes handle include monitoring for deadlocks, keeping an eye on available resources, and finding memory to free up.
When we monitor CPU activity, memory allocation, and higher level blocking and locking, we’re monitoring things related to SQLOS.
SQLOS contains a complete memory manager. Many applications rely on the host operating system for this, but SQL Server handles its own memory management. This is relevant because the way memory is allocated and used is a critical aspect of SQL Server performance monitoring.
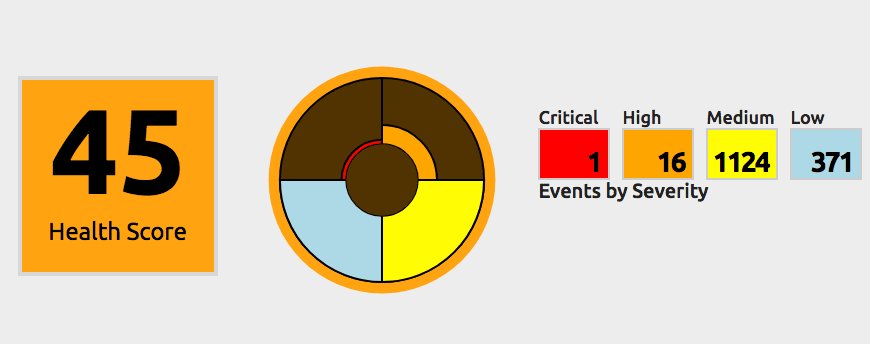
Holistic SQL Server Performance Monitoring
SQL Server architecture components work together to deliver a powerful enterprise class relational database platform. When measuring performance, we should consider the entire system. Nuances exist that defy logic. For instance, slow persistent storage performance could reveal that adjustments should be made to available memory. View relevant metrics together in a dashboard to get a full picture of performance.
Trends and Baselines
A consistent theme as you monitor SQL Server performance should be to baseline performance. Baselines let you understand the previous state of things to identify whether performance is trending positively or negatively. Capturing baselines in SQL Sentry is easy, and in most cases we’ll have a useful baseline ready for you automatically.
Monitor Resources
Resources are the computing capacity available to SQL Server. Historically, resources have been viewed as hardware components in a computer system. Today, the meanings we’ve attached to some resources have changed due to advancements like virtualization and cloud computing. In some cases, they are referred to as something completely different. Azure SQL Database defines a resource called Database Transaction Unit (DTU), for example.
It’s important to monitor resources needed by SQL Server. You can gain performance by targeting specific resources in contention. This highly effective remediation strategy is difficult, and potentially inaccurate, unless you’re monitoring resources.
Monitor SQL Server Wait Statistics
SQL Server records the amount of time a query had to wait during its lifecycle. The reason for waiting is also recorded and referred to as the wait type. Monitoring SQL Server wait statistics can save time troubleshooting by helping you understand why and how long processes are waiting.
Don’t Rely on Wait Statistics Alone
We covered monitoring resources prior wait statistics purposely. Analyzing wait statistics will help you understand where to start looking for problems. The wait statistics alone will not necessarily lead you to the root cause or resolution for a performance problem. Monitor wait statistics to understand where to begin. Next, analyze resource utilization to accurately reveal the problem and work to resolve it.
Network Traffic
Monitor incoming, outgoing, and total traffic. Where possible, you should capture this for individual network interfaces. This will help reveal whether the network interface itself is a bottleneck.
This information may not be easily gathered in the case of PaaS-based SQL Server.
Processing Utilization
Most deployment methods for SQL Server provide some way to capture processing utilization relative to processing capacity. For a full instance of SQL Server, capture performance counters from the “Processor Information” perfmon category. For Azure SQL Database, monitor DTU or vCore utilization.
Memory Allocation
Monitor overall memory capacity and utilization for the server hosting SQL Server where possible. This isn’t feasible for all deployments of SQL Server.
Monitor size and activity for SQL Server memory buffers. Pay particular attention to the buffer cache. Disk is generally a slower resource than memory. The buffer cache represents data stored in memory. The more “warm” data you can keep in the buffer cache, the less SQL Server has to read from disk. Keep an eye on the plan cache as well. The plan cache can become bloated, which reduces the available memory for the buffer cache.
SQL Server maintains a performance counter called “Page Life Expectancy” (PLE). The counter represents how long a data page should live in the buffer cache before it’s removed. You should monitor this counter for volatility. Seeing it drop rapidly outside of planned maintenance deserves a closer look. Guidance on acceptable values is shadowed by outdated information in various places. We’ll direct you to additional resources on PLE at the end of this article.
Performance pressure related to low available memory is one of the most encountered SQL Server performance problems. This makes learning about the memory manager a worthwhile time investment.
Storage Performance
Monitor performance of storage by collecting duration of reads and writes. These measurements are referred to as latency. Guidance on performance monitoring for different storage devices varies widely by manufacturer. “How long does it take?” is a meaningful performance measurement regardless of manufacturer.

Storage Capacity
Running out of space unexpectedly will make for a tough day managing your data platform. Monitoring free space and rate of consumption for storage can help you get ahead of it.
SQL Sentry provides machine learning-driven predictive capabilities for planning storage capacity. If you can’t plan capacity with that level of sophistication, you should perform growth trending at a minimum.
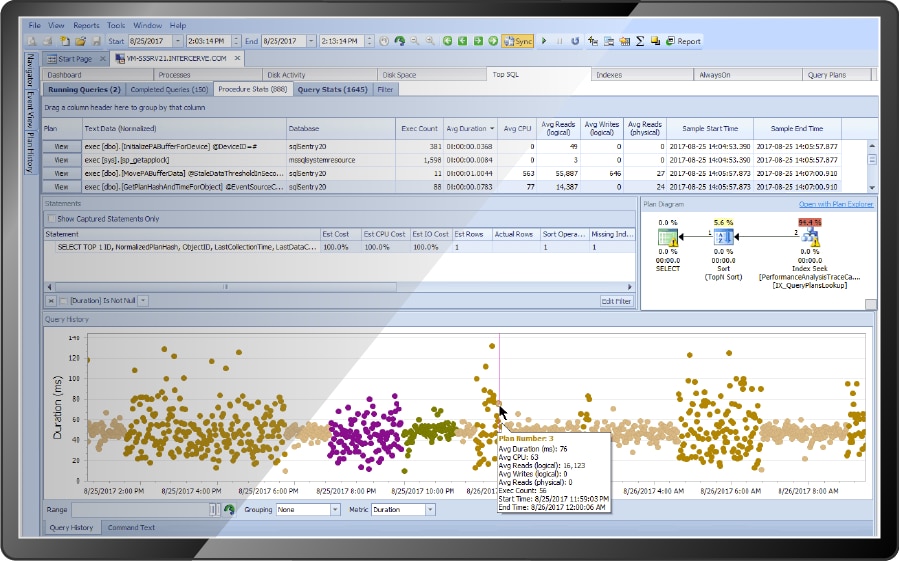
High Impact Queries
Capture and analyze the most resource intensive queries. You should consistently be working to improve the top 10 resource consumers. We call this Top SQL analysis. Ideally, you’ll be able to capture the query plans these queries use per execution as well. SQL Server Query Data Store can help with this.
SolarWinds provides a free tool to the community called Plan Explorer. Our performance monitoring solution, SQL Sentry, includes an enhanced version of Plan Explorer. The integrated version of Plan Explorer is used to analyze query plans with ease and without swapping between tools.
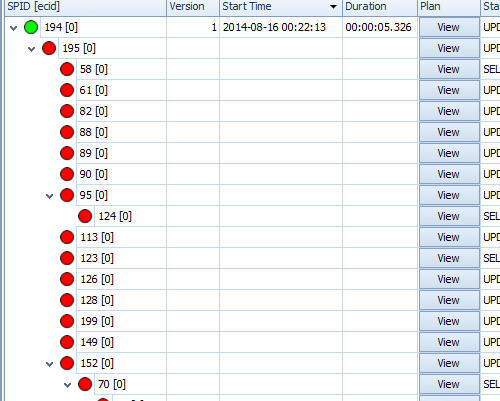
Long Running Blocks
Blocking and locking in SQL Server is normal. A highly concurrent transactional system requires locking and blocking. Problematic blocking occurs when blocking queries take longer than necessary. A “chain” of blocks can manifest as one process waits on the blocker and additional processes wait behind that process. These long block chains can often be resolved by performance tuning for the initial blocking query.
SQL Sentry includes a visual representation of these block chains. We clearly indicate the initial blocker and provide all the information needed to performance tune for the blocking query. This includes the query plan for the blocking query.
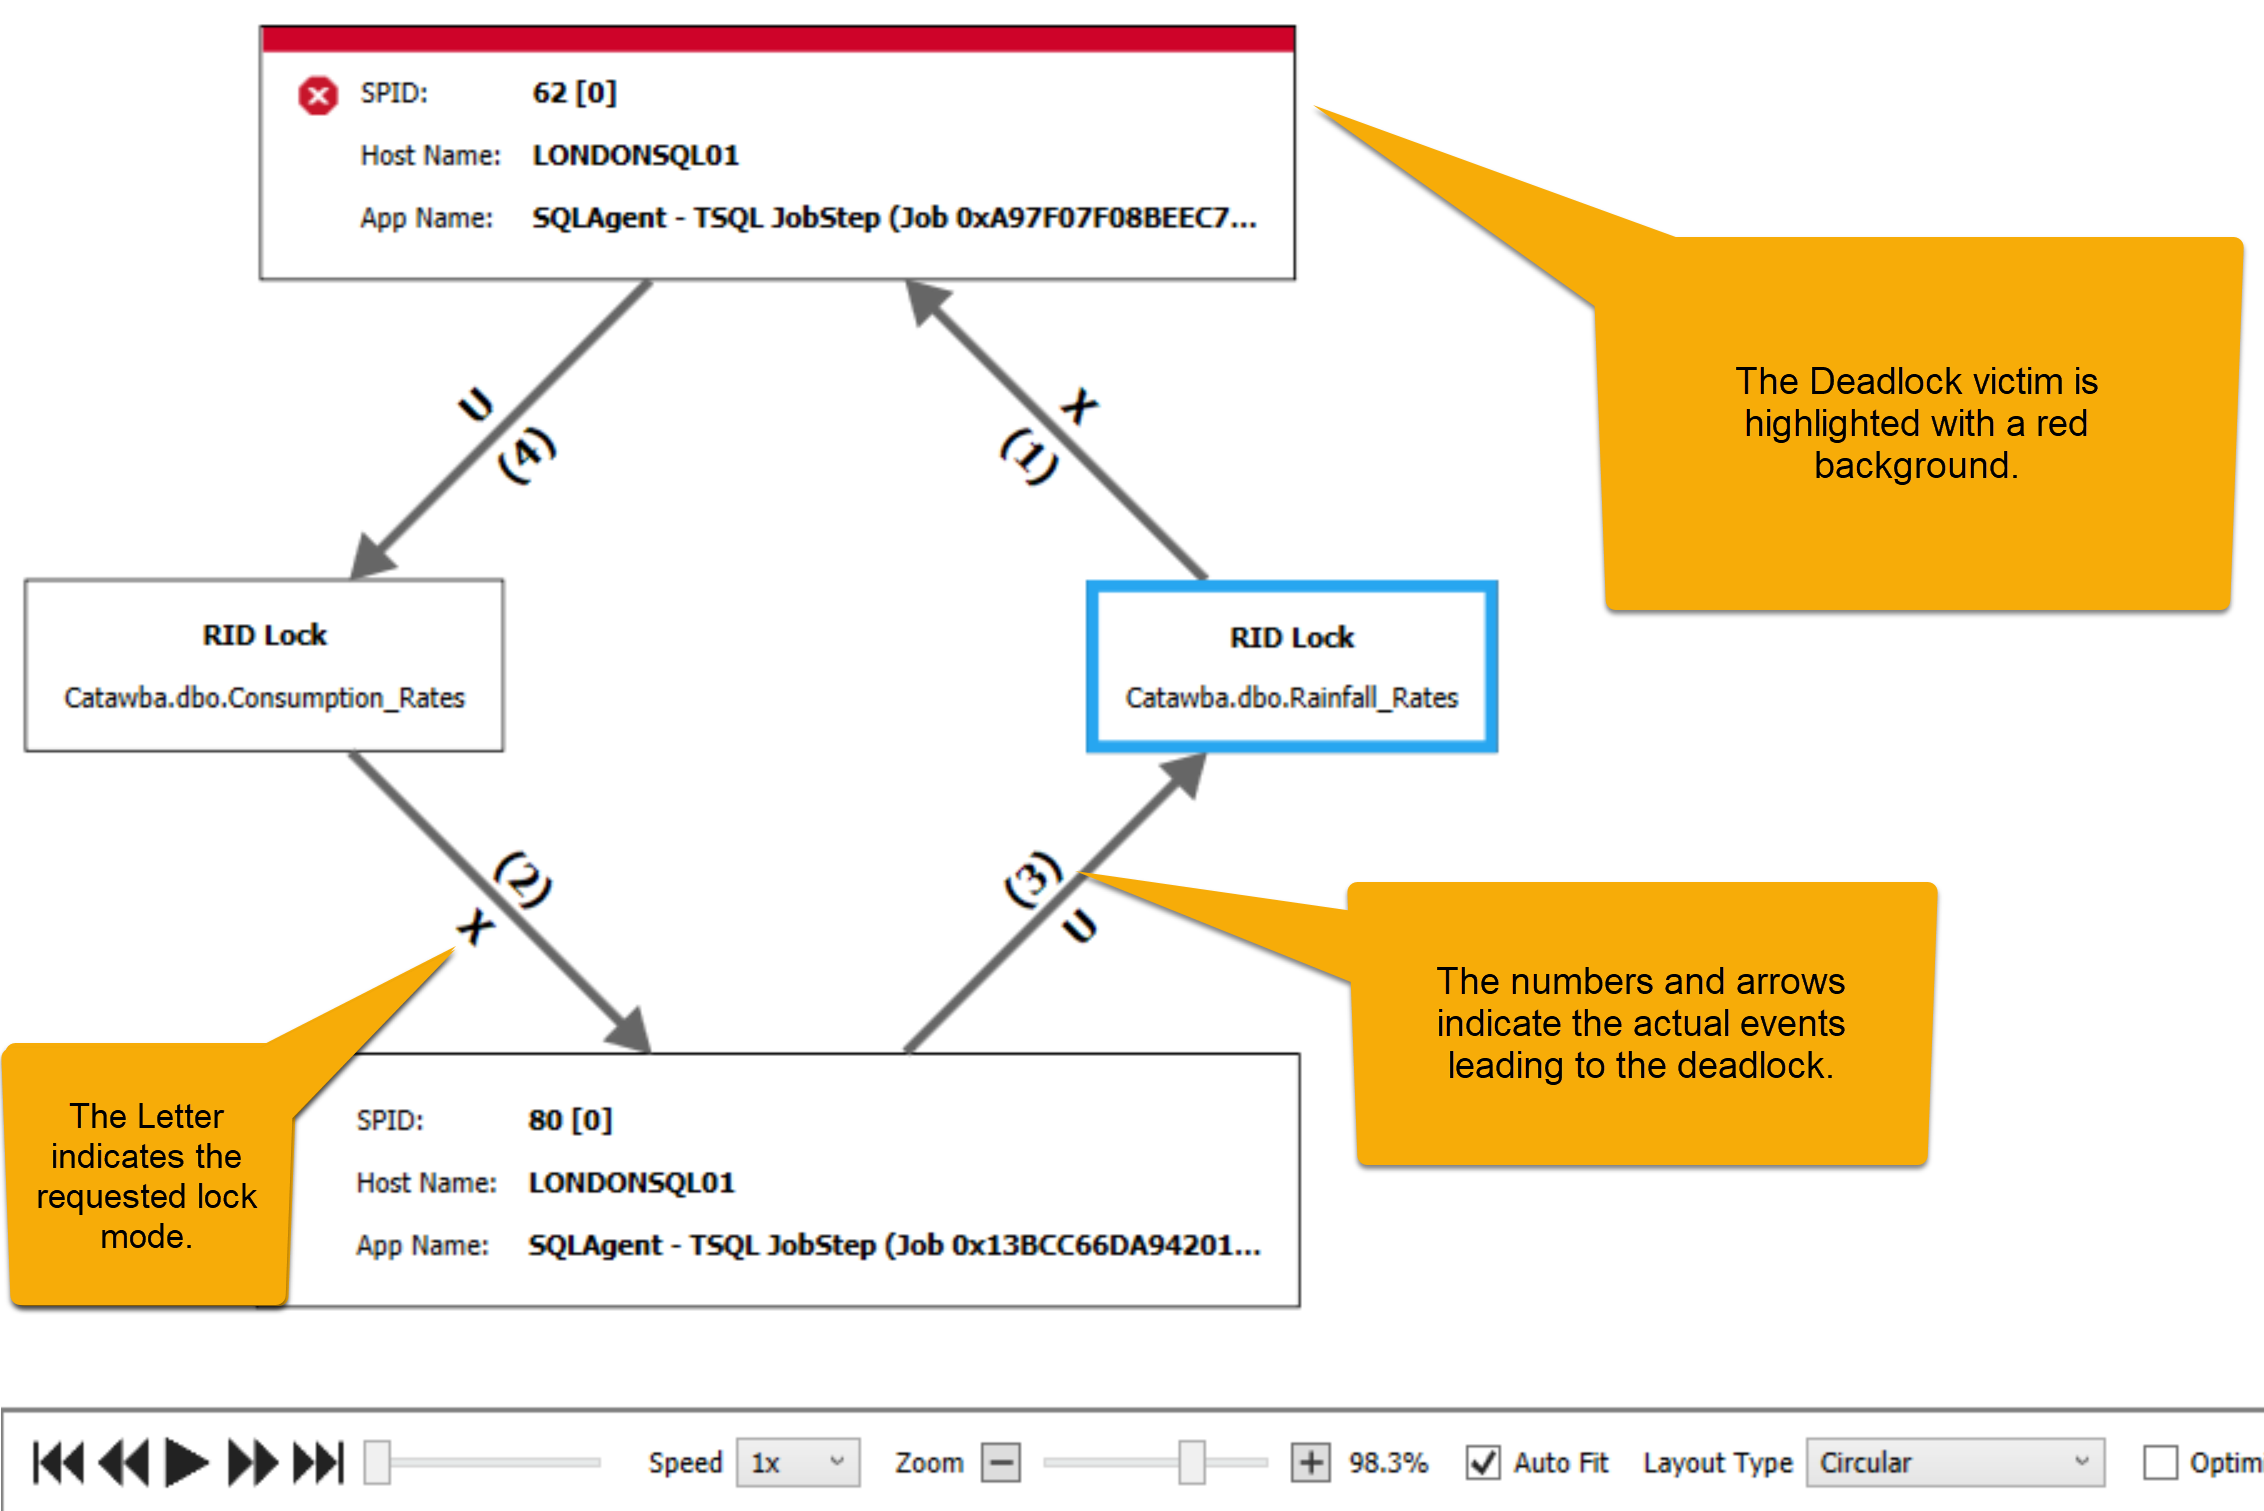
Deadlock Events
A deadlock occurs when one or more processes experience locking in such a way the none of them can possibly continue. When this happens, one of the processes is selected as a victim. Whatever the victim process was doing fails and throws an error.
Deadlocks are notoriously difficult to troubleshoot. Resolving them starts with monitoring for and capturing details on deadlocks. SQL Sentry provides an interactive diagram for deadlocks. The diagram clearly indicates the victim process and allows you to visually replay the order of locking events that lead to the deadlock. You can further analyze details of each process involved with the accompanying detail view.
Monitor All of the Above SQL Server Performance Metrics and Much More With SQL Sentry
SQL Sentry combines automated data collection with data visualizations specifically designed for SQL Server performance analysis. SQL Sentry goes beyond simple monitoring by correlating metrics to events. You’ll quickly discover what happened and why it happened with complete contextual relevance. See how SQL Sentry features compare against competitors.