If you’ve ever looked at the
COM_XYZ status counters in MySQL’s
SHOW STATUS output, you’ve probably seen
Com_admin_commands. It’s not clear what this means, but it can be a major contributor to overall
COM_ counters, and it’s actually quite important for server and application performance, as well as being a marker of code quality. In this blog post I’ll explain what the counter really means, and then as a bonus I’ll demonstrate that SolarWinds
® Database Performance Monitor (DPM) can show you exactly what’s going on in the murkiness of “admin commands.”

The first question is “what is this counter?” The manual isn’t really helpful. It just
says the following:
The Com_xxx statement counter variables indicate the number of times each xxx statement has been executed. There is one status variable for each type of statement.
That doesn’t really clarify at all, because if you know the MySQL protocol you know there
is no “admin command” statement. Fortunately, MySQL is open-source, so we can find out exactly what it means! And now that MySQL’s source code is on GitHub it’s even easier. Here’s a
snippet of code comment that explains what’s really inside that counter, which comes from a variable (in the source code) called
com_other:
#ifndef DBUG_OFF /*
We have few debug-only commands in
com_status_vars, only visible in debug builds. For simplicity, we enable the assert only in debug builds. There are 8 Com_ variables which don't have corresponding SQLCOM_ values (TODO strictly speaking they shouldn't be here, should not have Com_ prefix that is. Perhaps: Stmt_ ? Comstmt_ ? Prepstmt_ ?):
- Com_admin_commands => com_other
- Com_stmt_close => com_stmt_close
- Com_stmt_execute => com_stmt_execute
- Com_stmt_fetch => com_stmt_fetch
- Com_stmt_prepare => com_stmt_prepare
- Com_stmt_reprepare => com_stmt_reprepare
- Com_stmt_reset => com_stmt_reset
- Com_stmt_send_long_data => com_stmt_send_long_data
With this correction the number of Com_ variables (number of elements in the array, excluding the last element - terminator) must match the number of SQLCOM_ constants.
*/ compile_time_assert(sizeof(com_status_vars)/sizeof(com_status_vars[0]) - 1 == SQLCOM_END + 8); #endif
In a nutshell, this counter is an aggregate of some others (why they didn’t just keep them separate I don’t know). By grepping through the source code, I found the following things that increment
com_other:
- COM_CHANGE_USER
- COM_SHUTDOWN
- COM_PING
- COM_DEBUG
- COM_BINLOG_DUMP_GTID
- COM_BINLOG_DUMP
So those six commands increment what ends up being
Com_admin_commands. In practice, all but
COM_PING are fairly rare. The shutdown and debug commands don’t happen often, most applications don’t switch the connection’s user, and asking the server to send you its binary logs tends to be a single command followed by a very long stream of data, not a rapidly repeated command.
But still, saying “It’s probably just
COM_PING” is not good enough. I’m sure you have your own war stories to tell about how the most likely explanation sometimes wastes days of effort because the least likely thing turns out to be true after all.
Luckily, you have SolarWinds DPM! But before we get to that, let’s take a look at what
COM_PING really does.
Ping commands are generally a sign that something quite unwise is being done. I’ve written about this before in other places, but to recap, a lot of ORMs and connection libraries do race-prone pings to check whether a database connection is alive before they send a query on it.
I know that this is true in
Ruby On Rails:
def active? return false unless @connection @connection.ping end
I also know it’s true in
Perl’s Ima::DBI module, which is the foundation for a lot of other things in Perl:
# reopen if this is a new process or if the connection # is bad if ($process_id != $ or not ($dbh && $dbh->FETCH('Active') && $dbh->ping)) { $dbh = DBI->connect_cached($dsn, $user, $pass, $attr); $process_id = $; } return $dbh;
So what’s so bad about it? Quite a bit:
- It is the unmistakable code smell of a race condition. Pinging doesn’t guarantee the connection is still alive by the time you execute the command the caller wanted to run.
- It is completely wasted work. Far, far better to do it the way Go’s
database/sql package does, without a Ping at all.
- It adds latency to the application. You might think it doesn’t add much, because come on, a ping is a no-op, right? But it does. It’s a bunch of work for the application, followed by a network round-trip plus typically about 50 microseconds server-side, and then a bunch more work for the application.
The net effects of all these libraries doing race-prone, latency-adding pings all the time are a bad user experience and more brittle applications. If you’re using an ORM or database library that does this, you should use something else instead. (When I was a consultant, a bunch of my Rails clients used to monkey-patch the
active method after I pointed out all of the above. I have a feeling a nontrivial percentage of Rails apps are running in production with this silliness monkey-patched out… double-silliness!)
And now I will prove to you with measurements what I’ve claimed with words above. Because, naturally, you can measure this with DPM!
Measuring Pings With SolarWinds Database Performance Monitor
At this point we know more about
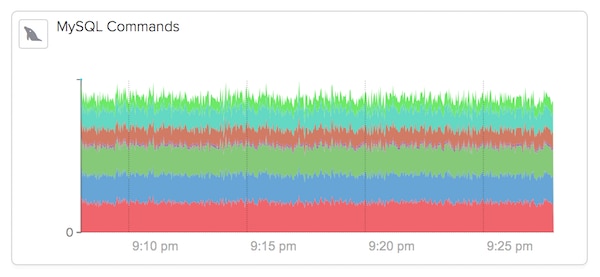
COM_PING, but we don’t yet know the impact. The first thing you might notice with DPM is the size of the
Com_admin_commands stripe in your Commands graph. Here it’s the red stripe on the bottom (in the app you can see that if you mouse over it, but I’m not showing that here because it takes up too much vertical space).
Now, if we didn’t know what was inside that counter, we’d have to stop there. But in DPM,
every command to the server is represented as a query. If we go to Top Queries, and rank by Count, we’ll see the following:
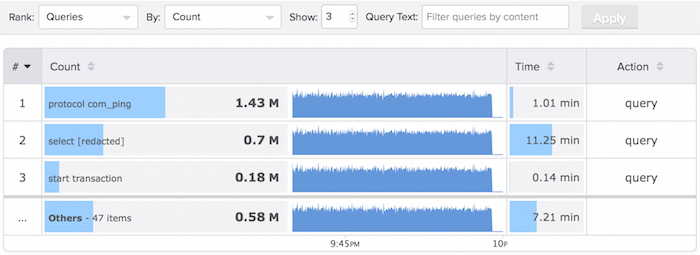
Notice that the number 1 query by count, more than twice as big as the second one, is
protocol com_ping. That’s the pseudo-query we use to identify this protocol command. It is about half of the total queries this server runs (which makes total sense, because with an ORM like the ones above, every time you run a query, you run this command first). And look, during the 20-minute period shown in the screenshot, it accumulated more than a minute of total latency!
Naturally, we can switch to view queries by time instead of count. Do you think pings are far down the list? No, they rank #4 by total time, accounting for more than 5% of the total work this server does.
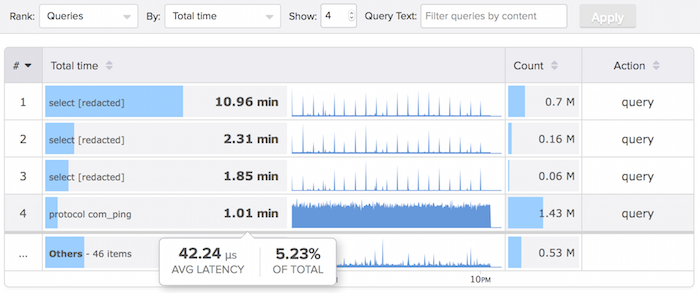
The story from the app’s point of view is even worse, because that 5% of server-side latency is magnified by the network round trip and the processing the app has to do.
If I told you that there was “this one weird trick to get 5% more capacity from your servers and reduce end-user latency and improve quality of service,” would you do it? If you had 20 servers and wanted to get rid of one of them, you certainly would.
In conclusion, with D{<, you’ve got a powerful set of tools to find out what your servers are really doing, in production, with practically no overhead, and better yet practically no effort. Just open up the app and it’s two clicks to insight.
Recap
In this post I explained that…
Com_admin_commands is a combination of commands not accounted separately inside the server; usually COM_PING but could be other things- If it is pings, it’s the sign of a badly written database connection library, and in my experience it is a frequent cause of performance problems for the server and the app
- DPM measures everything the server does, even if they’re not queries, and lets you very easily see what’s really going on in your production systems.