In the popular white paper entitled Troubleshooting SQL Server Wait Statistics, I take you through three scenarios in which a wait stats-only approach is insufficient or even harmful to detecting, diagnosing, and resolving performance problems on an instance of SQL Server. One of the most common questions that I get about the information in that white paper is “How do I do all of that cool stuff you do in Performance Advisor (PA) with the native tools?” I’ve decided to kick off a series of blog posts to answer that question in a step-by-step fashion.
The white paper identifies FIVE key steps to effective performance troubleshooting on Microsoft SQL Server (below).
SQL Server Troubleshooting Checklist
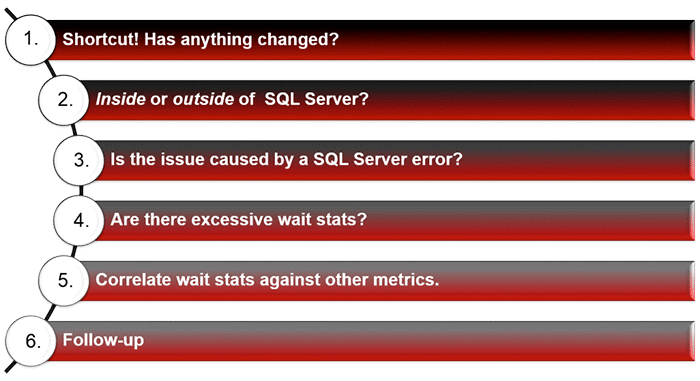
But are there any shortcuts or means by which we can skip one or more steps?
YES!
There are actually two shortcuts you can take advantage of. But in both cases, they require preparation, setup, and on-going maintenance and grooming:
Shortcut #1: Monitoring and Alerting
Your first shortcut is to use a strong monitoring and alerting system is your very best shortcut to the step-by-step troubleshooting methodology. After all, getting an alert telling you that you’re experiencing a specific problem is a pretty good hint that you’ve got some troubleshooting to do. In fact, I’d put forward the idea that an enterprise isn’t really serious about its data if they don’t monitor and alert on their important SQL Server databases.
If you’re not familiar with the industry-leading monitoring and alerting features of Performance Advisor, be sure to read the white paper entitled SQL Server, SharePoint, and Windows Alerts.
As discussed in a separate white paper on troubleshooting, Performance Advisor (PA) includes the industry’s most powerful alerting, monitoring, and diagnostic tools for Microsoft SQL Server. However, this blog entry is about how to use native tools to get as close as possible to what PA can do. And while it’s not perfect, you can get some decent alerting functionality using SQL Agent Alerts. If you are not already using SQL Agent alerts, read Tim Radney’s SQLPerformance.com blog post, SQL Server Agent Alerts.
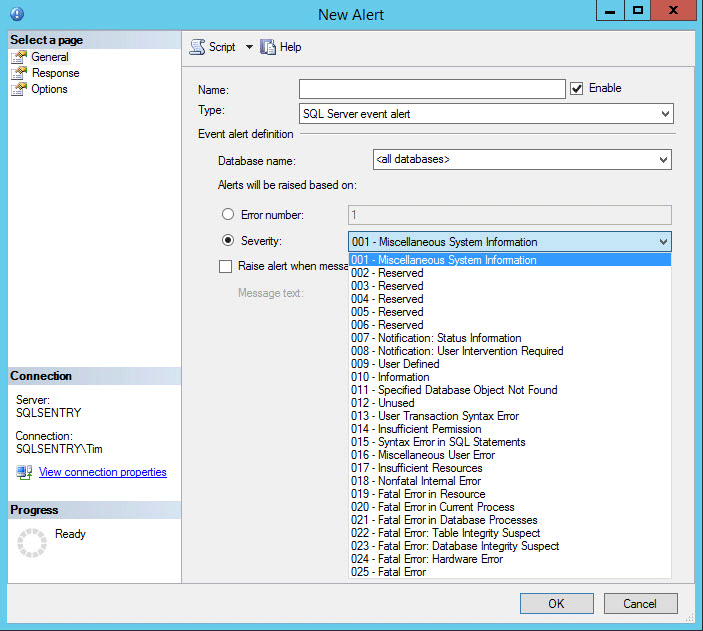 Figure 1: An Example of Creating a SQL Agent Alert
Tim takes you through the basics of using SQL Agent alerts, as well as takes you through setting up alerts for SQL Server errors of severity level 19 through 25. These are most severe and noteworthy error messages originating inside of SQL Server. Everyone should monitor for their occurrence.
Shortcut #2: Always Know What Has Changed on Your SQL Servers
Your second shortcut is to control and track changes to your SQL Server(s) in such a way that you can always ask, in the face of poor performance, “What’s changed since the server was last performance well?” Sometimes that question is easy to answer without any analysis of your change logs because an organizational change has occurred, for example, if the company opened a new sales office on Monday morning which started to drive a lot of added OLTP workload against the Sales database.
What is much harder to track and a lot more pernicious is the situation in which multiple people, maybe everybody on the Dev team, has sysadmin-level access to the production SQL Server. I’ve seen this happen, where all sorts of people are changing database schemas, in many IT enterprises. It’s a horrible situation for a DBA to be in. And, to use the old Southern saying, may I just say “Bless your heart.”
DDL Triggers to the Rescue!
The good news is that we can keep track of schema changes to a given database and, by extension, the entire instance, using DDL triggers. As the name implies, DDL triggers are created using the CREATE TRIGGER syntax. However, they do not fire on standard DML statements like INSERT, UPDATE, and DELETE. Instead, they fire on DDL statements like CREATE PROCEDURE, ALTER TABLE, or DROP VIEW.
No need to re-invent the wheel here! My friend and colleague, Aaron Bertrand (b | t), has written about DDL triggers in several articles over the years. My two favorites are online at MSSQLTips.com and SQLBlog.com. They’re both quite good and give you more than enough information to figure out how to implement DDL triggers on your own instance.
That way, in the face of future performance issues, you can ask others with sysadmin access to a database whether they’ve made changes or not. And then you can check to see whether they’re telling you the truth. I can’t tell you how surprised some of my Dev teams were when I explained that I could see they added several stored procedures the day before performance went into the dumps. “Oh, well, yeah. We may have added one or two really tiny things. But it shouldn’t have any impact on performance at all,” they’d say with shifty eyes and sweaty palms.
Ok. That’s part one of the multi-part series complementing the white paper entitled Troubleshooting SQL Server Wait Statistics. Do you have any added questions? Do you want more detail on a particular topic? If so, then get in touch with me by posting a comment here! Many thanks,
-Kevin
Connect with me online! Facebook | Twitter | LinkedIn | Blog | SlideShare | YouTube | Google Author