Over at the Percona Performance Blog, Vadim recently
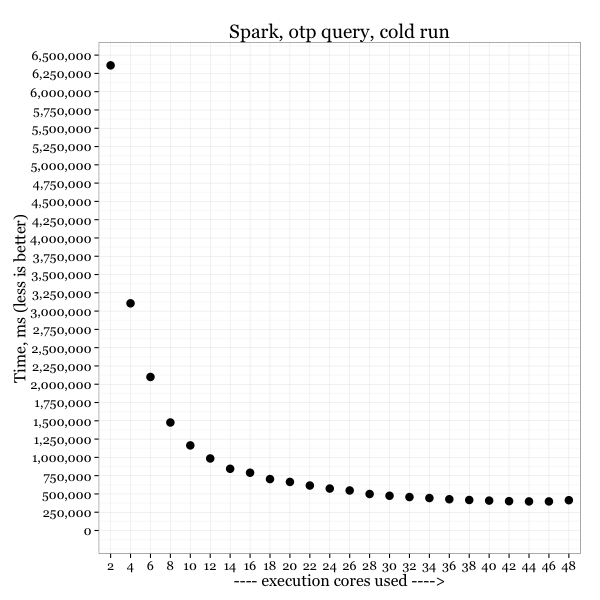
published benchmark results for Apache Spark, and the shape of the graphs caught my eye. Here's one of Vadim's charts:

The benchmark shows how query latency (total runtime) changes as Spark is configured to run the query across a varying number of CPU cores. More cores is faster, which is great, that's what we should expect.
If you read my ebook on the Universal Scalability Law, you know it can be rearranged to model MPP (massively parallel processing) speedup in systems such as Spark. The equation is on page 47. We don't need to delve into the equation here, but as I explained in the book, the USL models systems that have some overhead when parallelizing queries. There are two types of costs it can model: serialization, which limits how fast the queries can get as you run it across more and more cores; and service time bloat, which will actually cause worse performance at higher core counts.
Does the USL model Vadim's benchmark results well? To find out, I asked Vadim for the numeric results, and then I turned to
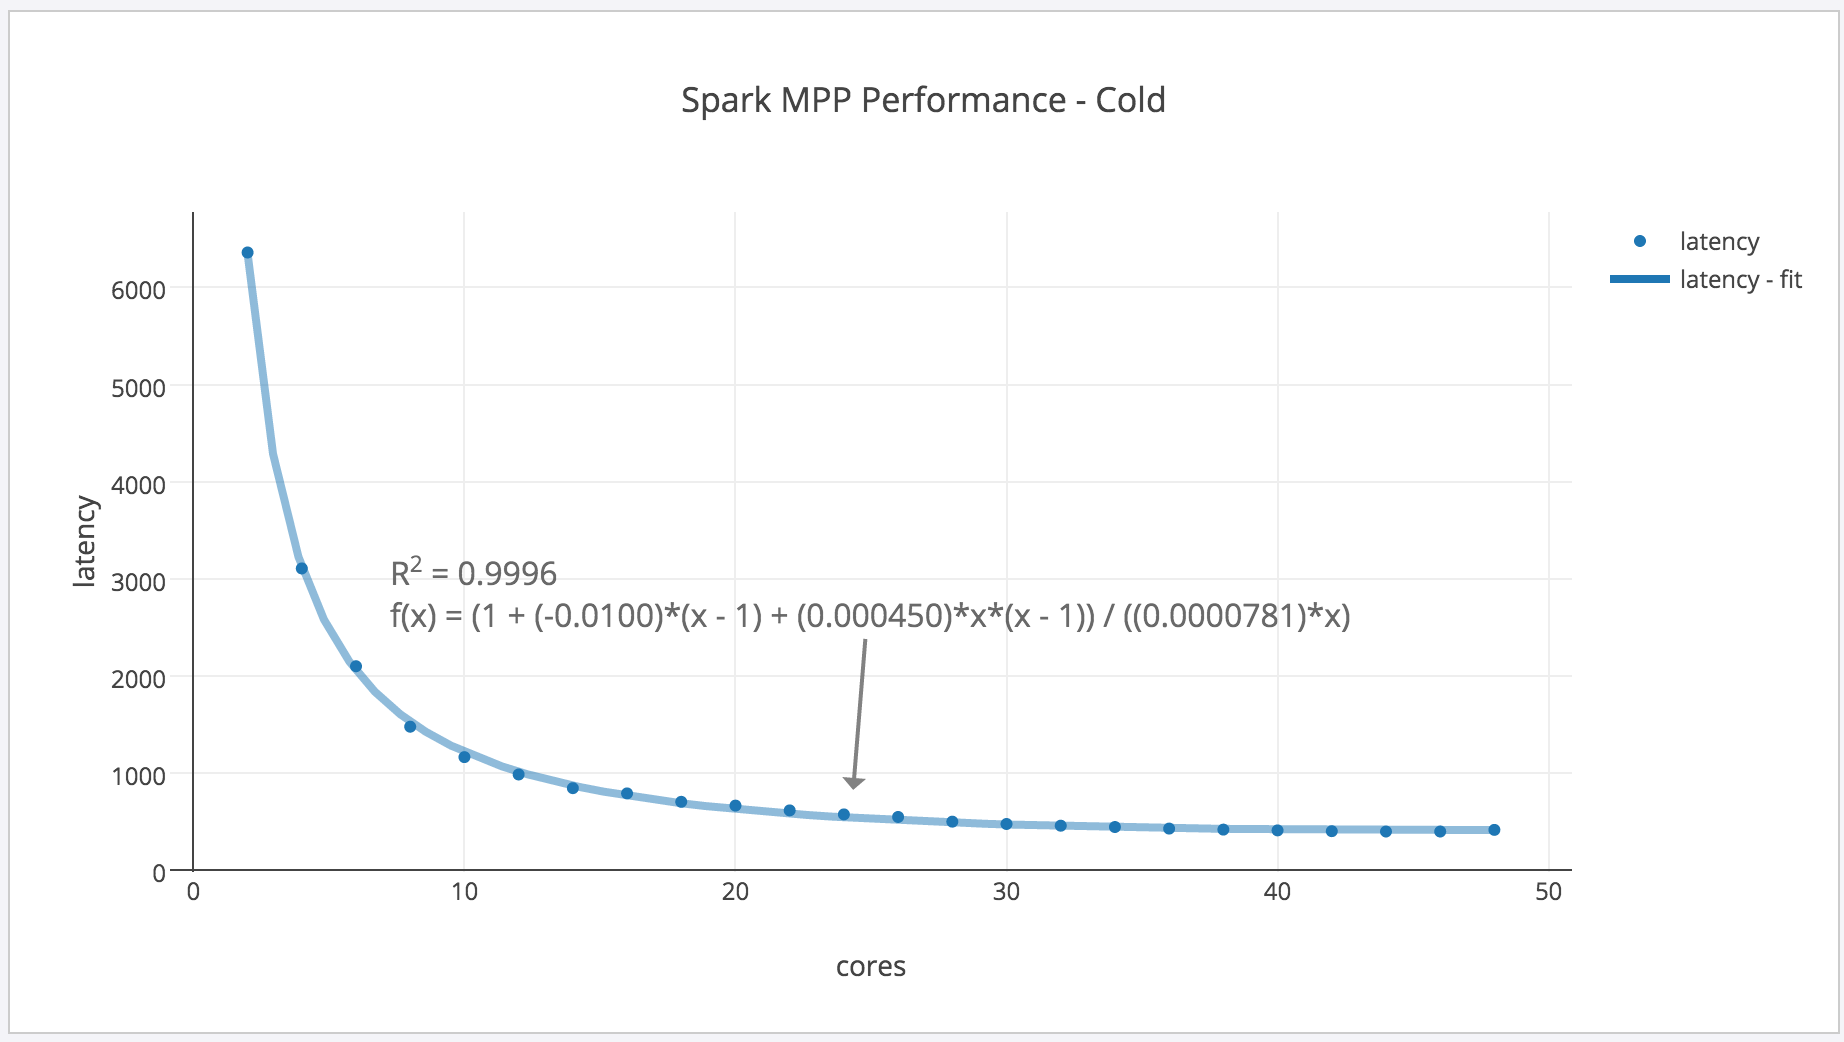
plot.ly, which is my new favorite tool for this type of analysis because it's sharable online and is quite easy to use for this type of basic analysis. I fit the rearranged USL to the results. You'll note that the y-axis units are different because I divided by milliseconds to obtain query latencies in seconds. Here's the result:

You can view this in plot.ly at
this link. What the annotated chart shows is that the second coefficient is very small: practically zero. The first coefficient actually optimizes to a small negative number, which is a topic I won't explore here, but
you can read more about if you like. So, in summary, yes the USL can be used to model this data. However, as you'll note after I explain a bit more, the costs of running on cold caches are dominating, so Spark's scalability itself is basically lost in the noise. This chart doesn't tell us whether or what kinds of internal inefficiencies Spark contains.
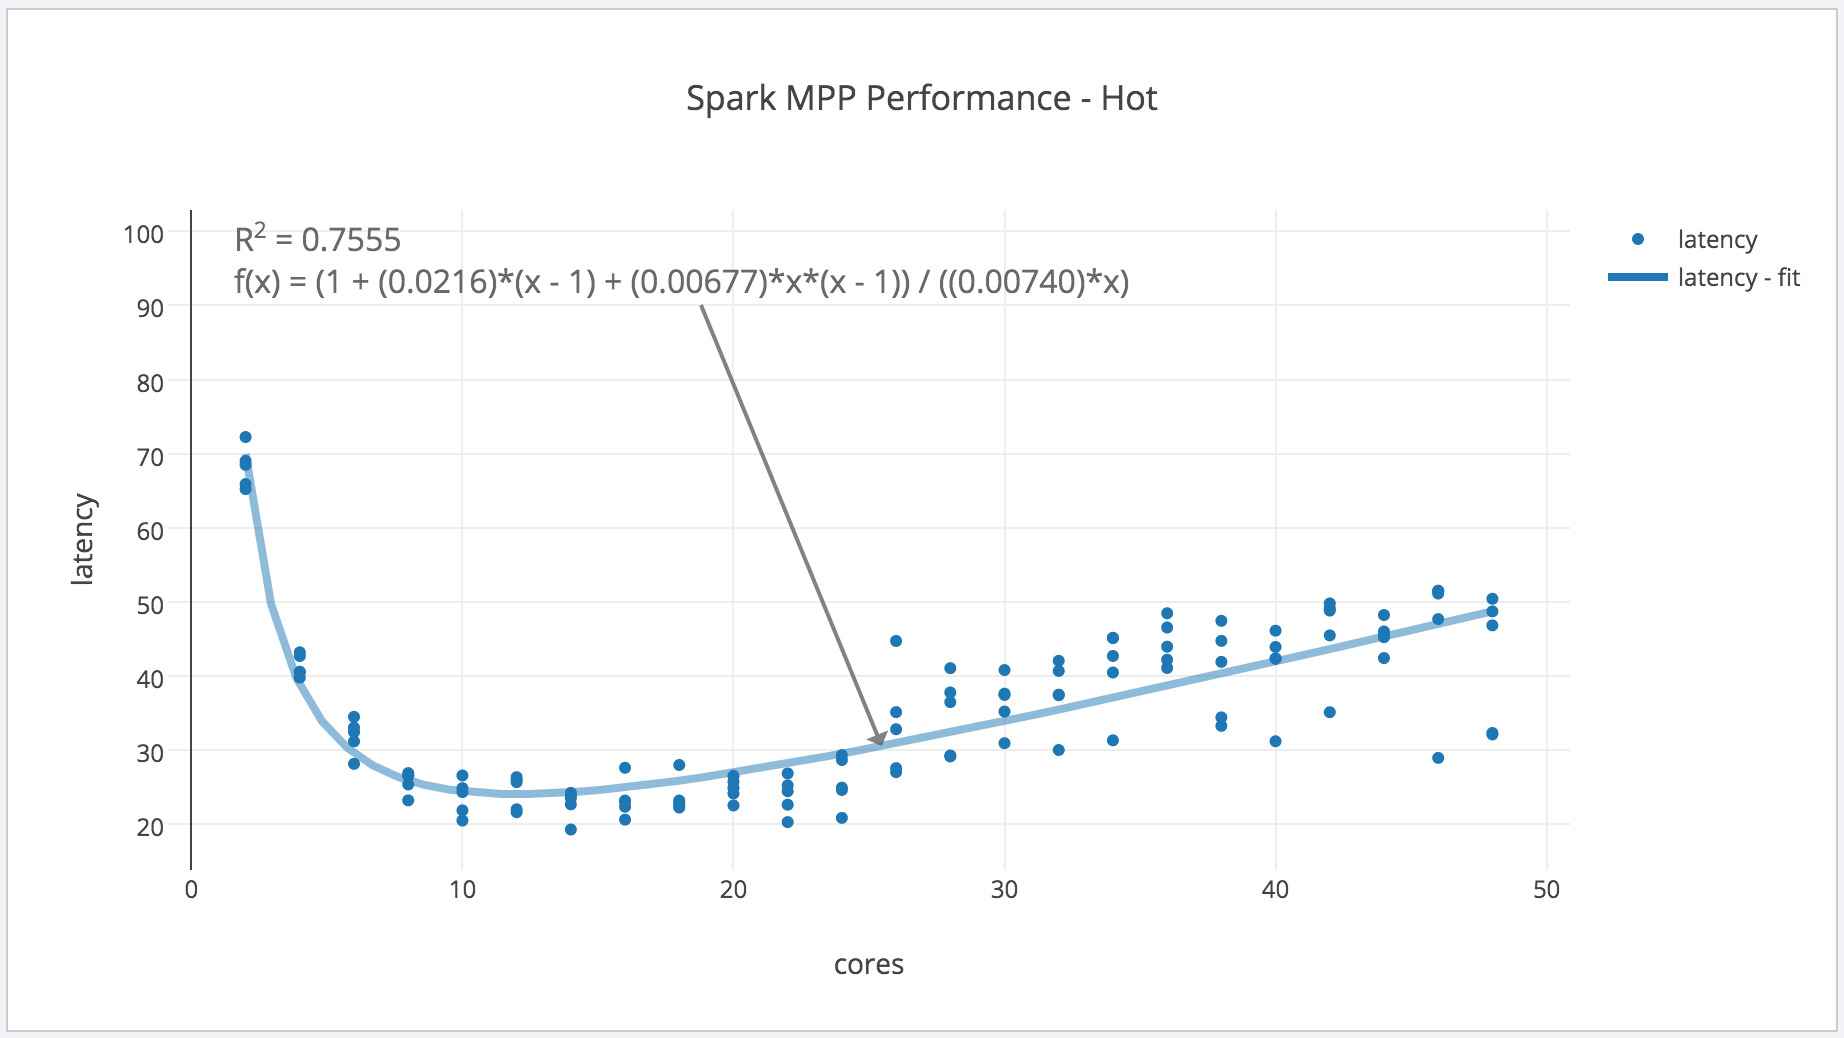
The second chart in Vadim's blog post is more interesting, because it shows that for "hot" runs where the data is already loaded into cache, Spark actually gets
slower at higher core counts: retrograde scalability! This is due to the aforementioned response time bloat, which the USL can also model. Here's
a chart of the result:

This is a perfect illustration of the importance of doing multiple benchmark runs, because data that's loaded into memory behaves completely differently than cold caches. Notice, first of all, how much faster the queries run: much, much faster than cold. In this case, the effects of Spark's internal scalability matter a lot, and you can see that the non-negative second parameter makes a big difference: Spark is performing worse at higher core counts. This is a key limitation of this type of system that you might not discover unless you perform the types of benchmarks Vadim did, and the types of analysis the USL enables. (Kudos to Vadim for running these benchmarks; as you can see from the query latencies, it takes a long time.)
What can we take away from the analysis of these benchmark results? I would suggest that Spark can be improved to scale better. It has some small amount of serialization as the job is distributed and then the results are reassembled, which is always expected in a scatter-gather MPP systems. I would also suggest that response time "stretching" may point to internal contention
or tail latency, which is often a problem in MPP systems too. You can't figure out which merely by glancing at a graph, but you can get started in the right direction.
 The benchmark shows how query latency (total runtime) changes as Spark is configured to run the query across a varying number of CPU cores. More cores is faster, which is great, that's what we should expect.
If you read my ebook on the Universal Scalability Law, you know it can be rearranged to model MPP (massively parallel processing) speedup in systems such as Spark. The equation is on page 47. We don't need to delve into the equation here, but as I explained in the book, the USL models systems that have some overhead when parallelizing queries. There are two types of costs it can model: serialization, which limits how fast the queries can get as you run it across more and more cores; and service time bloat, which will actually cause worse performance at higher core counts.
Does the USL model Vadim's benchmark results well? To find out, I asked Vadim for the numeric results, and then I turned to plot.ly, which is my new favorite tool for this type of analysis because it's sharable online and is quite easy to use for this type of basic analysis. I fit the rearranged USL to the results. You'll note that the y-axis units are different because I divided by milliseconds to obtain query latencies in seconds. Here's the result:
 You can view this in plot.ly at this link. What the annotated chart shows is that the second coefficient is very small: practically zero. The first coefficient actually optimizes to a small negative number, which is a topic I won't explore here, but you can read more about if you like. So, in summary, yes the USL can be used to model this data. However, as you'll note after I explain a bit more, the costs of running on cold caches are dominating, so Spark's scalability itself is basically lost in the noise. This chart doesn't tell us whether or what kinds of internal inefficiencies Spark contains.
The second chart in Vadim's blog post is more interesting, because it shows that for "hot" runs where the data is already loaded into cache, Spark actually gets slower at higher core counts: retrograde scalability! This is due to the aforementioned response time bloat, which the USL can also model. Here's a chart of the result:
 This is a perfect illustration of the importance of doing multiple benchmark runs, because data that's loaded into memory behaves completely differently than cold caches. Notice, first of all, how much faster the queries run: much, much faster than cold. In this case, the effects of Spark's internal scalability matter a lot, and you can see that the non-negative second parameter makes a big difference: Spark is performing worse at higher core counts. This is a key limitation of this type of system that you might not discover unless you perform the types of benchmarks Vadim did, and the types of analysis the USL enables. (Kudos to Vadim for running these benchmarks; as you can see from the query latencies, it takes a long time.)
What can we take away from the analysis of these benchmark results? I would suggest that Spark can be improved to scale better. It has some small amount of serialization as the job is distributed and then the results are reassembled, which is always expected in a scatter-gather MPP systems. I would also suggest that response time "stretching" may point to internal contention or tail latency, which is often a problem in MPP systems too. You can't figure out which merely by glancing at a graph, but you can get started in the right direction.


