What Should We Be Monitoring?
To effectively begin getting a grasp on your applications performance, you must begin mapping out all the components in the path of your application. It might be wise to begin with the server or servers where your application lives. Again, this could be multiple different scenarios depending on the architecture housing your application. Or it could easily be a mixture of different architectures.
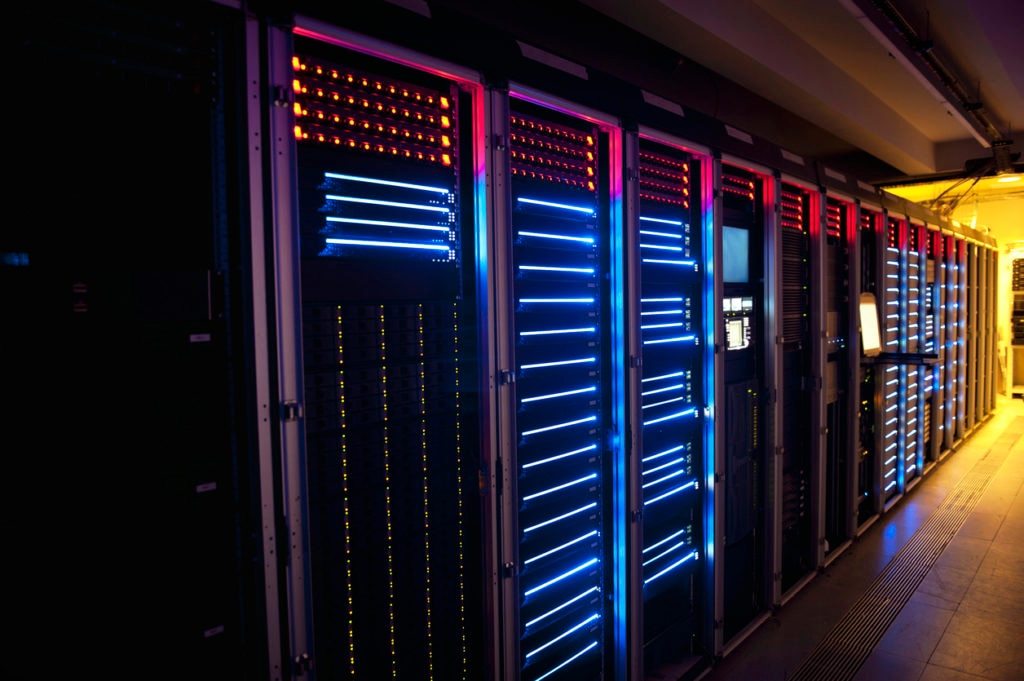
Let's say your application is a typical three-tier app that runs on several virtual servers that run on top of some hypervisor. You would want to start collecting logs and metrics from the hypervisor platform such as CPU, memory, network, and storage. You would also want to collect these metrics from the virtual server. Obviously, in addition to the metrics being collected from the virtual server, your application logs and metrics would be crucial to the overall picture as well. If, for some reason, your application does not provide these capabilities, you will need to either develop them or rely on some other existing tooling that you could easily integrate into your application. These metrics are crucial in identifying potential bottlenecks, failures, and overall health of your application. In addition to what we have already identified, we also need to collect metrics from any load balancers, databases, and caching layers. Obtaining all these metrics and aggregating them for deep analysis and correlation gives us the overall view into how our application is stitched together and assists us in pinpointing where a potential issue might arise.How Should We Be Monitoring?
We have now identified a few of the things we should be monitoring. What we need to figure out next is how will we begin monitoring these things and ensure that they are accurate as well as providing us with some valuable telemetry data. Telemetry data comes from logs, metrics, and events.
Logging (Syslog)
First, let's begin with logging. We should have a centralized logging solution that can not only receive our log messages, but also have the ability to aggregate and correlate events. In addition, our logging solution should provide us with the ability to view graphs and customized dashboards, and also provide us with some level of alerting capabilities. If we have these initial requirements available to us from our logging solution, we are already off to a good beginning.
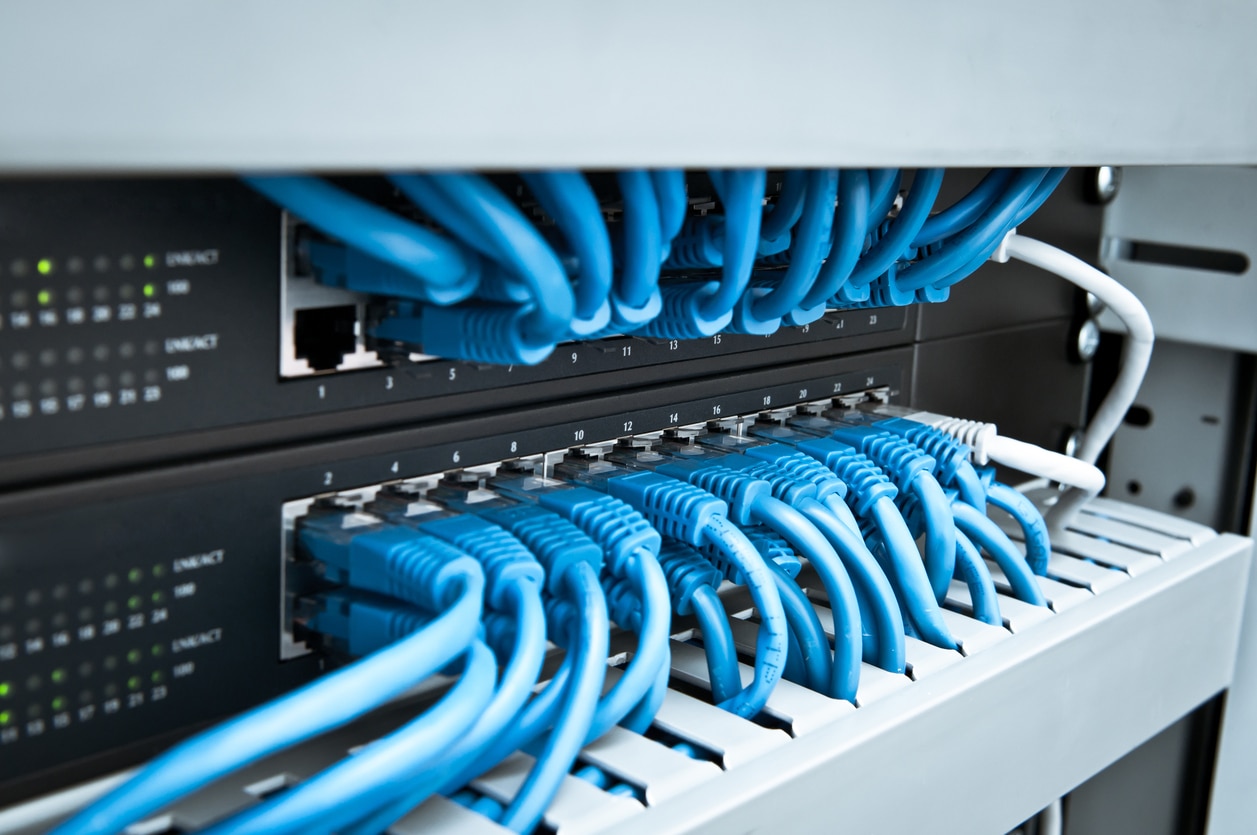
Now we need to begin configuring all our hypervisors, servers, load balancers, firewalls, caching layers, application servers, database servers, etc. There are many, many systems to ensure we are collecting logs from. But we need to make sure we get everything that is directly in the path of our application configured for logging. Also, remember that your application logs are important to be collected as well. With all these different components configured to send logging data, we should begin seeing events over time, painting a picture of what we might determine as normal. But remember, this might be what we termed after-the-fact application monitoring.Metrics
There are numerous different methods of obtaining metrics. We should be clear about one thing when we begin discussing these methods, and that would be not using SNMP polling data. Now don't get me wrong--SNMP polling data is better than nothing at all. However, there are much better sources of metric data.
Our performance metrics should be time series-based. Time series-based metrics are streamed to our centralized metrics collection solution. With time series-based metrics we can drill into a performance graph at a very fine level of detail. Most time series-based metrics require an agent of some sort on the device that we would like to collect metrics from that is responsible for providing the metrics that we are interested in. The metrics we are interested in include those that were mentioned before: CPU, memory, network, disk, etc. However, we are interested in obtaining metrics for our application stack as well. These metrics would include application-related metrics such as response latency, searches, database queries, user patterns, etc. We need all of these metrics to visually see what the environment looks like, including the health and performance. With metrics and logging in place, we can begin correlating application performance with the events/logs to start understanding what the underlying issue might be when our application performance is degraded. Read part three: Benefits and Examples.