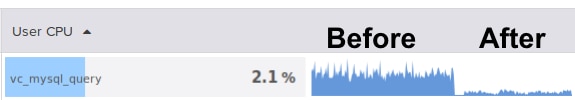
SolarWinds Database Performance Monitor (DPM) now supports partial network capture to reduce load while monitoring MySQL database servers, where a trade-off between full visibility and monitoring overhead might be desirable. This reduces our already-low overhead and enables higher accuracy in certain circumstances. Here’s a before-and-after image:
To review, one of ways we measure production MySQL query behavior at SolarWinds is with libpcap, which sniffs network packets passively. Sometimes people think we’re “polling” or “sampling” to capture only a fraction of server activity, but in fact by default we see and analyze
everything in full, packet-by-packet detail. And therein lies the problem.
The Problem
Our default network capture technique means we measure literally everything your server communicates with apps that query it. Every query, every error, everything.
We’ve worked extensively to optimize this process, reducing the overhead of packet capture to very low levels (typically less than 1% of total system CPU). This represents a huge engineering achievement you would have to invest enormous time and money to accomplish yourself. But at very high packet rates, we still sometimes saw the following circumstances arise:
- Packets arrived so fast that the kernel didn’t have time to communicate them to the SolarWinds DPM agent. (DPM's agent is a passive bystander, not a man-in-the-middle, and this does not result in network packets actually being dropped, just in DPM’s agent failing to see them.)
- The DPM agent consumed more CPU than desired. Never more than 100% of a single CPU, and usually less than 20% even in high-load cases, but still more than customers liked.
Although customers often want to know about agent CPU usage, the first effect is actually the more worrisome.
DPM’s agent is passive and resource-constrained. If there’s idle CPU on the system, then there’s no harm in using it. What’s more troublesome is missing packets and not being able to reassemble the conversation accurately.
We’ve also done a very significant amount of work on this, and have been able to cope, to a remarkable degree, with spotty network capture — another hard engineering problem. But still, sometimes it’s better to just capture a fraction of the traffic correctly and at very low overhead, than to capture all of it poorly.
The Solution
The solution is to ignore some of the data. You can think of it like the radio station that isn’t quite strong enough to hear in stereo. In some older radios you could switch it off stereo mode and enjoy your music more clearly. That’s sort of what we’re talking about here.
So how do we do it? We do it by ignoring some packets on selected connections. This is accomplished with BPF, which pushes packet filtering as close as possible to the data firehose in a small, very efficient, dynamically compiled set of machine instructions. Packets that don’t match the filter never even reach user-space.
There are several possible ways to capture a subset of packets, and after analysis we decided on capturing
all packets from a
subset of TCP connections rather than, for example, capturing only some packets from all connections. There are a few important consequences.
- Choosing a specific set of TCP connections and capturing everything that they do means that we at least get a coherent view of specific conversations between clients and servers, rather than getting a partial view of lots of things. For servers that are handling a high-speed series of mostly homogeneous workloads, this is close to ideal.
- For the greatest efficiency, using bitmap masks is the highest-performance way to filter out packets. This is easy and lightning-fast to do with powers-of-two.
- We’re getting a biased estimator by looking at a sample of the population. This is standard statistics and is probably obvious to readers, but I mention it here for completeness. For computational efficiency, we do not try to generate an unbiased estimate of the population.
- Some long-running connections that run a non-homogeneous workload, such as those DPM creates to capture MySQL-specific metrics from the database, will not be captured at all.
In practice, the way it works is as follows.
- We by default capture and measure all packets from all connections and (implicitly) multiply the resulting measurements by 1.0 to generate metrics.
- There is a new parameter that allows filtering out connections by the originating port number with a bitmask from bit 1 to 8. This means we only see packets from connections whose port, bitwise AND’ed with the mask, is nonzero. We will then measure one
2**Nth of the connections. If you set the mask to 1, then we’ll see 1⁄2 of the connections. If you set it to 8 then we’ll see 1/256th of them.
- By default, we’ll then change the multiplier to the inverse, so if we measure 1/8th of connections we’ll multiply all the metrics by 8, for example. But if you explicitly set a multiplier that will be used instead of the default.
Results
You already saw a chart of CPU at the top of this blog post, but I’ll repeat it for fun. We capture per-process CPU, I/O and more from your operating system, so we can see exactly how this change impacts agent resource usage. Here’s the agent’s CPU again:
System CPU decreases about the same as user CPU, too. At the same time, we see changes in related metrics such as context switches:
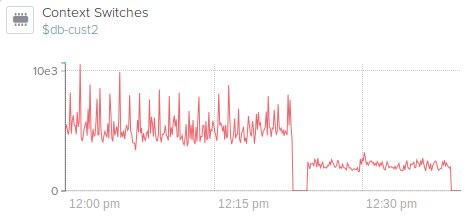
The context switches decrease because of the C-to-go calls that our agent makes to interface with libpcap.
And the query metrics themselves? Because of the biased sampling as mentioned previously, the magnitude stays about the same, but the variance increases when viewed in high-resolution (
DPM captures everything in 1-second resolution):

And as expected, some metrics which are generated from long-running connections just aren’t caught, but in most cases these are unimportant and uninteresting:

Conclusion
With configurable partial network data capture,
SolarWinds DPM gives you the flexibility to choose the balance you want between complete capture, accuracy, and overhead. By choosing to capture traffic on only one Nth of connections to the database server, you can capture less data but still be able to see full conversations between apps and databases. By default, DPM will multiply the resulting metrics to produce a biased estimate of the full traffic sent to the server, so you’ll see the same magnitude of metrics, albeit with higher variance.
If you’d like to enable this feature on your systems, just contact our support team. It just involves an agent reconfiguration and restart on our side, and has zero risk. We’re happy to not only enable it for you, but to monitor server behavior before, during and after so you don’t need to worry about a thing and it’s as convenient as possible. And we’ll tell you we don’t recommend enabling this feature, if we don’t think it will help or isn’t necessary.
If you’re not already benefiting from DPM’s unprecedented deep-dive visibility into what your database servers are doing in production, feel free to
sign up for a risk-free trial and see for yourself.