Quite some time ago, when we added the ability to monitor MySQL query performance statistics from MySQL’s
PERFORMANCE_SCHEMA, we learned a number of valuable lessons, still worth sharing. There are definitely right and wrong ways to do it. If you are looking to the P_S tables for monitoring MySQL query performance, this blog post might save you some time and mistakes.
First, a quick introduction. The Performance Schema includes a set of tables that give information on how statements are performing. Most of the P_S tables follow a set of predictable conventions: there’s a set of tables with a limited set of full-granularity current and/or historical data, which is aggregated into tables that accumulate over time. In the case of statements, there’s a table of current statements, which feeds into a statement history, that accumulates into statement summary statistics. The tables are named as follows:
| events_statements_current                          |
| events_statements_history                          |
| events_statements_history_long                     |
| events_statements_summary_by_account_by_event_name |
| events_statements_summary_by_digest                |
| events_statements_summary_by_host_by_event_name    |
| events_statements_summary_by_thread_by_event_name  |
| events_statements_summary_by_user_by_event_name    |
| events_statements_summary_global_by_event_name     |
The tables most people will care about are
events_statements_current, which is essentially a replacement for
SHOW FULL PROCESSLIST, and
events_statements_summary_by_digest, which is statistics about classes of queries over time. The rest of the tables are pretty much what they look like – summaries by user, etc.
These tables were introduced in MySQL 5.6, and not all of them will be enabled by default. There’s a performance overhead to enable them, but this should be small relative to the performance improvements you can gain from using them.
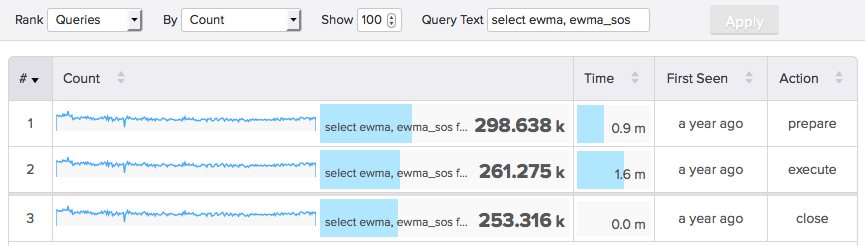
We prefer our technique of decoding network traffic server-side to measure query performance for several reasons, but the statement digest table is the next-best thing in cases where that’s not possible, such as with Amazon RDS. It gives us enough data to present a view of top queries as shown below.

Now let’s dig into specifics about these tables and how to use them.
For most MySQL performance monitoring tools, the general method is to read from
events_statements_summary_by_digest at intervals and subtract each sample from the next, to get rates over time. As you can see in the below sample, there are a lot of columns with various statistics about each family of queries in the table:
text
mysql> select * from events_statements_summary_by_digest  limit 1\G
*************************** 1. row ***************************
                SCHEMA_NAME: customers
                     DIGEST: 4625121e18403967975fa86e817d78bf
                DIGEST_TEXT: SELECT @ @ max_allowed_packet
                 COUNT_STAR: 36254
             SUM_TIMER_WAIT: 2683789829000
             MIN_TIMER_WAIT: 45079000
             AVG_TIMER_WAIT: 74027000
             MAX_TIMER_WAIT: 1445326000
              SUM_LOCK_TIME: 0
                 SUM_ERRORS: 0
               SUM_WARNINGS: 0
          SUM_ROWS_AFFECTED: 0
              SUM_ROWS_SENT: 36254
          SUM_ROWS_EXAMINED: 0
SUM_CREATED_TMP_DISK_TABLES: 0
     SUM_CREATED_TMP_TABLES: 0
       SUM_SELECT_FULL_JOIN: 0
 SUM_SELECT_FULL_RANGE_JOIN: 0
           SUM_SELECT_RANGE: 0
     SUM_SELECT_RANGE_CHECK: 0
            SUM_SELECT_SCAN: 0
      SUM_SORT_MERGE_PASSES: 0
             SUM_SORT_RANGE: 0
              SUM_SORT_ROWS: 0
              SUM_SORT_SCAN: 0
          SUM_NO_INDEX_USED: 0
     SUM_NO_GOOD_INDEX_USED: 0
                 FIRST_SEEN: 2014-09-12 16:04:38
                  LAST_SEEN: 2014-10-31 08:26:07
These columns are mostly counters that accumulate over time. The
COUNT_STAR column, for example, shows the number of times the statement has been executed. The
SUM_ columns are just what they look like.
Enabling And Sizing The Table
The table needs to be enabled as usual with the Performance Schema by using its setup table,
setup_consumers. That table contains a row for each P_S consumer to be enabled. Other setup tables and server variables control some of the configuration as well, though the defaults work OK out of the box most of the time.
The table can also be sized, in number of rows. By default it is 10,000 rows (although I think somewhere I saw a documentation page that said 200).
Limitations Of The Table
There are a couple of limitations you should be aware of.
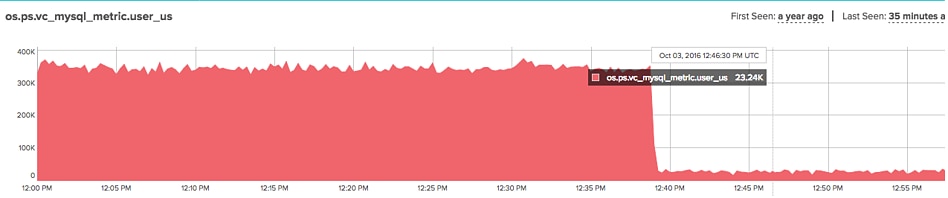
- The statement digest table does not record anything about statements that are prepared. It only captures statements that are executed by sending the full SQL to the server as text. If you use prepared statements, the table probably does not capture your server’s performance accurately. The drivers for many programming languages use prepared statements by default, so this could be a real issue. (If this is a problem for you, you might like to know that VividCortex captures prepared statements from network traffic, including samples).
- The table is fixed-size. Resizing it requires a server restart.
- Some things aren’t captured in full granularity. For example, when we’re capturing MySQL query performance data from network traffic, we can measure specific error codes. There’s a
SUM_ERRORS column in the table, but you can’t see what the error codes and messages were.
Resetting The Table (Or Not)
The table can be reset with a
TRUNCATE to start afresh, but generally shouldn’t be. Why would you want to do this? There might be a few reasons.
First, the table is fixed-size, and if the table isn’t large enough to hold all of the distinct types of queries your server runs, you’ll get a catch-all row with a NULL digest and schema. This represents statements that aren’t being tracked separately and might be important for some reason. A
TRUNCATE will empty the table if this is the case.
Second, statistics accumulate over time, so columns such as first-seen and last-seen dates may eventually end up being useless to you. The min, max, and average timer waits will not be very helpful over long periods of time, either.
Finally, you might want to reduce the number of rows the table contains, so that occasional queries that are never purged don’t introduce performance overhead when reading the table.
There are tools that do this completely incorrectly, however. Some of them empty out the table every time they read from it. This is worst-case behavior because these tables are not session-specific. They are global, and a
TRUNCATE will affect everyone who’s looking at them. At the very least, it might be kind of rude to constantly throw away the data that your colleague (or another tool) is looking at.
The other problem is that a tool that reads from the table then truncates it is subject to race conditions. Statements that complete between these actions will be discarded and never seen. Of course, there’s no way to avoid this, except by just not doing it, or not doing it often.
I would suggest resetting this table only manually and only when needed, or perhaps at infrequent intervals such as once a day or once an hour, from a scheduled task.
Accumulating Statements Correctly
The table’s primary key isn’t defined in the schema, but there’s a unique set of columns. This is not, contrary to what I’ve seen some software assume, the
DIGEST column. There is one row per digest, per schema. The combination of schema and digest is unique.
This means that if you’re looking for all information about a single class of queries regardless of schema, you need to aggregate together all of the rows with the same
DIGEST.
One of the implications of the uniqueness being defined by schema and digest together is that servers that have a large number of schemas and a large number of digests will need a really huge number of rows to keep track of all of the statements. At VividCortex, we have customers whose servers have literally millions or tens of millions of distinct families of queries running on a regular basis. Multiply this by a large number of schemas, and you have no hope of keeping track of them with the P_S tables. This is not a problem for our default collection mechanism, though: by default
we capture MySQL query performance statistics by decoding the server’s network traffic. This handles high-cardinality scenarios without trouble.
Don’t Run GROUP BY On The Table Frequently
There are several ways you can cause performance impact to the server by reading from the P_S tables.
One is by using complex queries on these tables. They are in-memory, but they’re not indexed. For example, if you run a
GROUP BY to aggregate rows together by digest, you’ll cause trouble. You probably shouldn’t do this, at least not frequently.
Recall that VividCortex measures everything at 1-second resolution, giving you highly detailed performance statistics about your entire system. The statement statistics are no different; we have per-second statement (query) statistics. Reading from the P_S table once per second with a
GROUP BY clause has too much performance impact on the server.
Don’t Re-Fetch Data
To avoid-re-fetching rows that haven't changed, our MySQL agent records the max(Last_Seen) in the table each time it reads it. It then excludes results that haven't been updated since that last read time, to reduce the data it needs to read from the table, making it much more efficient overall.
Another way to cause problems is to fetch the
DIGEST_TEXT column with every query. This column isn’t enormous, because it’s limited to 1kb in length, but it’s still large enough that you should not repeatedly fetch it. Instead, when you see an unknown digest, you should query for it only then. This may introduce a lot of complexity into your application code, but this is what needs to be done.
Capturing Sample Statements
Capturing samples of queries is very helpful. Aggregate statistics about groups of queries aren’t revealing enough; you need to be able to look at specific instances of queries to EXPLAIN them and so on.
To get samples, you’ll need to look at the current or historical statement tables. Not all of these are enabled by default, though.
Some tools
LEFT JOIN against the statement history tables to get samples of individual query executions. This obviously should not be done at 1-second frequency. Even if it’s done infrequently, it’s not really a great idea. When you have fine-detailed performance instrumentation you can really see small spikes in server performance, and an occasionally intrusive query can potentially starve high-frequency fast-running queries of resources.
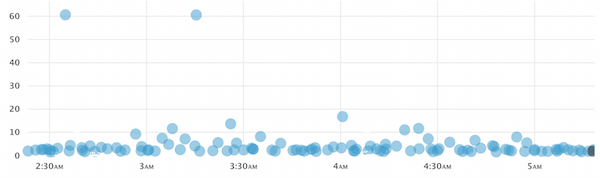
VividCortex’s approach to this, by the way, is to collect samples probabilistically, which is different from the usual practice of trying to find a “worst” sample. Worst-sample is okay in some ways, but it is not representative, so it doesn’t help you find out much about a broad spectrum of queries and their execution. Here’s a screenshot of what our sampling approach yields, which is quite different from the picture you’ll get from worst-sample tactics:
Conclusions
Although we prefer to be able to capture and decode network traffic to see the full detail about what’s happening inside the server, in cases where that’s not possible, the Performance Schema in MySQL 5.6 and greater is a good alternative. There are just a few things one should take care to do, at least at 1-second resolution as we do at VividCortex. And there are a few common mistakes you can stumble over that will either be bad behavior or might make your results just plain wrong.