The zero-trust model is critical for building a successful strategy to detect both internal and external cybersecurity threats. This approach requires setting and maintaining strict access controls and “no trust” as the default to all, including those already inside your network. There are several steps needed to properly evaluate your organization’s current state before you can start implementing best practices.
In this episode of SolarWinds Lab, SolarWinds security product experts will break down the key components of the zero-trust model and show you how businesses of all sizes can assess compliance. They’ll also show you how to use SolarWinds security tools to help you build a better zero-trust foundation.
Episode Transcript
On today’s episode, we’re gonna discuss zero trust security models. And with COVID, employees are demanding that employees actually have enabled flexible work styles, which means apps are moving to the cloud. A company’s device and application mix are increasingly heterogeneous. All of these factors are breaking down the enterprise security perimeter, rendering traditional security approaches obsolete, but this is paving the way for the zero trust approaches. So today, we’re gonna discuss the five pillars of what the zero trust security actually mean. So that’s gonna be device trust, user trust, transport session trust, application trust, as well as data trust.
By just looking at those five pillars, looking at user trust, we can definitely deliver some great features around that with Access Rights Manager.
And today we’ll be looking at application trust with SAM, which is going to help you to monitor your environment for any incidents and events. It’s always great to be proactive rather than reactive when you’re talking about zero trust and looking into any insider, as well as adding outsider threats.
And we’re also gonna discuss it with Network Configuration Manager and Server Configuration Monitor. And what those are gonna be able to help us with is the device trust, your transport layer, as well as your application trust and data trust. So let’s go ahead and dive in.
Getting started on zero trust, we’re gonna look at the user trust pillar first. And with that, we’re gonna look at Access Rights Manager. Access Rights Manager really takes care of all your user permissions within your infrastructure. So, zero trust is really based on a least privilege principle, and with Access Rights Manager, you can ensure that users only have the amount of access rights that they really need to have in order to do their job. And your very first step with before you getting started on managing user permissions, you should look into who has what access as of today, you should analyze everything, document everything and then you getting started on changing everything. And with that, I’m gonna hand it over to Sven who’s gonna guide you through the product.
Thanks Manja, first step that I would do in this case is of course, to go to the dashboard and to see what kind of, perhaps misconfigurations you might have in your environment. And one of the interesting things is for example inactive accounts. So you can use ARM quickly to check for your inactive accounts or inactive computers over time and see what accounts these are and perhaps disable them or delete them, getting them out of your system. The other things are, for example, you see here, a lot of due things, groups in recursions, for example is also an issue that’s quite often happening. So for example, that you have several groups that are members of each other. And the issue with that is, that you might have them in a situation where a group or a group of accounts gets permissions of all these groups. So for example, if you take a look here, we have here a recursion happening. So this group is a member of this group, and, that group is again member of this group. So, that’s not a perfect situation. And that’s something that we might want to change. And this is something that you can quite easily do with ARM by simply removing them here, for example, either this group membership or the other one that is part of that. And as you can see here below, any activities or actions that you perform in ARM needs add a comment, so that you always know who has, not only who has done this but why something has happened because the why is the most difficult thing to find out afterwards. Another good, interesting metric is also here, the Kerberos Token size, not because of the Kerberos Token size, but the Kerberos Token size gives also a good indication of how many members, group memberships and the account has. And this means, this could, for example, be an indication that this user is overprivileged in certain levels. So, you can simply click on this user, for example, and quickly see on the left side how many group memberships he has and what groups. And again here, you can quite easily change them or even then in this list, start to search for a certain area that you might be interested in. And then you, for example, see all these groups and can change them. Okay, this is just the starting point so that you see misconfigurations, but, let’s take a look now at the status quo or analyze the status quo of your permission structure. So for example, we are interested in who has access to a certain folder on your file server, which is called marketing. So, this is the directory that I’m interested in, redirects me to the resource you and I see here marketing highlighted. And on the right side, I see the permissions that are set there and available. What interests me here the most is not only all of the permissions, but also, as you see here below, we have how often granted, that means, if you sort the list, you can easily see that we have some users that have multiple paths where they get permissions from. So for example, if I take a look at this user here, Lodvig Karlsson, I see that he has a read and execute permission, but also a modifying permission on the marketing folder. And what if our permission is to the user being direct member of the resource group, and read and execute, he gets why a functional group that is called marketing. So, it seems to be quite okay, so that’s not an issue, but in other cases, you might find weird situations where you have modify and full control permissions that they shouldn’t have. If you, for example, take also an indirect view on the access rights, can also see quickly, that for example, we have solid users that get direct access still to this folder. Same here for read and execute here for modify, which is not a best practice and, which you should perhaps change. If you find something like that in your environment because we have best practices like AGDLP that Microsoft introduced simply to keep your system clean or to take the complexity out because complexity is the enemy of security, so you should keep that in mind. So, after having seen all these things the information, who has permission on, for example, a marketing folder, you can, of course at any time, create a same thing as a report so that you have to do is, whatever you want in a PDF, Excel, or whatever format. And you can even schedule the execution and get this report sent to, for example, the responsible manager or data owner, if you are following a data on a concept. What you can also do of course is, you can have a Usersview report or you can change that. In this case, as an example, I just created a quick Usersview report, which takes a little bit of time, but not that long. And what we need to see now here is the title, which describes all necessary configuration details about a report, and that you also be aware that they are no scan error detected, so that you have a valid information here. And then, as you see the data below, you see the report for marketing, for the marketing folder, for example, you see all the users and what kind of permissions they have. That’s going down, so all the photos that we have, and, at the end of the report, just let me scroll down a little bit, find also then, of course, as the structure of the groups and who is members of the groups. And last but not least, of course, you have also an explanation about what each of these icons means, so that a nontechnical user can also better understand what he is looking at, okay. What your client can of course also do is, we can also have alerting capabilities on changes in the ADR on file servers, with ARM, so let me open the management area here. So for example, for changes in directory, just take a look quickly at this alert. For example we can, I’m already on directory permission, ACL changes. So for example, if you have a sensitive area where you have your HR data or finance data stored, you can monitor this, not only for activities, but also alert if some changes are pure. So for example, in this way, for the ACL change on directories, and on file permission changes, then you can set, for example, a threshold, if you would for example, create a report on deletion or whatever, and you can also create actions on this. So for example, sending an email to a certain group of people, you can ride to the Windows event log, you can execute a script, or you can even send us a SysLog message to any FCM you’re using, for example, SAM from SolarWinds. The other thing is that, you should also document changes. So, this is something that you, as I already mentioned, that you need to provide this information, why you have done a change with every action. And you see this information later in the log book, or for example, here with our object, where you have to use a little piece of paper. If you double click there, you are redirected into the information and then you see the complete life cycle of this object. So you see what happened over time, before example this folder with every user, with every group. And you see then, actually the complete information. So for example here, that was the user account. This is the command why something happened, you’ll see the changes in detail step by step, that happened. And, you see even the credentials that were used for that. You can even go into logbook directly. If you don’t want to go by the resource itself, you can select timeframe so for example, let’s go back a little bit in time, so that we have more entries in here. And then, we see here in the matrix, the activities that we are locked and we can so for example, take a look at account created, then we see the filter being applied. And if you look at one of the dates, it’s Tuesday for example, we see the activities that happened, and of course the details below in that window down there. Good. So, the next thing is user creation. We can create use, also to create users. And, the thing is here that you can use a variety of templates that we already created. For example, we can take marketing user that we want to create, and then we have a template. And this template, if we start to fill this out, you will notice that our fields are dependent on this field and being, also filled out, like for example, SAM account name, we can choose drop-down menus, the organization unit, and other parts of this area, even group memberships that are given initially to the user. And this template will create a user according to the template you created. So, for example why are different sets of permissions of AD attributes? And this is being stored in a file in a JSON script language. This might be, let’s say a little bit difficult in the beginning, but it gives you a lot of flexibility that allows you because you can have validation rules with it. And this is for the initial user creation process. And then we have of course the profiles, and these profiles are used for the mover activity within your company. So if you have a user that moves from marketing to sales, and allows you then to change the permissions as needed, and this avoids that you have in over-privileged user over time.
Thank you so much. Sven for demoing and showing us the product and all it can do. So to wrap this up what you can really do with Access Rights Manager is you can analyze your access rights to your resources, and also based on every single user within your infrastructure you can then create reports out of that. You can create a documentation that is audit ready for you to go. And on top of that, you can monitor and log everything happening based on your user access rights, and have that forwarded to any kind of CM, or if you like to Security Event Manager. And with that, we’re handing over to Ashley and Brian for Security Event Manager.
Thanks to Manja and Sven for talking us through some of the user permission management. It’s really helpful and it kind of covers how you both assess and manage risk over time. Next, we’re gonna be moving into how you contain risk and highlight security event manager or SEM. Basically, we’re looking at how you detect any unusual security events, and then how you monitor that over time, as well as responding, so blocking or allowing certain activity within your environment, and being able to just report and then adapt on those policies over time. So security event manager is typically your incident and event tool. It’s gonna help you with one single pane of glass to log events across your environment, giving you some real time security incident awareness and helping you to reduce your threat detection and response times. So, we actually have a couple of tools built into the product itself, which is file integrity monitor and USB defender, which Brian is gonna demonstrate for us in this demo, to see how it can help you keep your environment secure in the zero trust framework.
Thanks Ashley for the intro. So security and event manager can definitely help you with the tracking a zero trust. We do monitor logs. So we have logs coming in via SysLog. We also have agents out there deployed on your servers. We monitor things in real time, so we can see when things are happening right now. We do that with, especially on the agents with the file integrity monitor. The idea is that, as those events are occurring, you can be alerted. You can see them here on the screen and get that real time impact. So if something starts to go stray, you know about it right away, which is great. We also, before I dig in, we also have the ability to monitor USB keys. This is something that, during COVID has been a really big benefit to our end users, to our customers. They’re able to watch their end users and see if maybe they’re doing activities they normally wouldn’t do at work. You know, you want to know, is, are people plugging in USB keys? Are they, you know, what are they doing on those? We’re able to actually, you could set policies to make them inject those right away. So they don’t have time to copy things. So again, we can monitor both sort of the threats from outside, but also the threats from inside as well. So I’m gonna go ahead and just a quick overview of this page is we’re looking at a summary of all the events coming in. We’re counting the events, we’re summarizing by type. We are summarizing the different, like here by a specific type, login failures. Of course, this is one of the things you’re looking at in zero trust is, “Hey are people trying to log in and failing?” Where, you know where’s that happening? What logs are those coming in as, and those types of things. And we’ll drill in and do some filtering in just a second, but you can see we’ve got lots of summaries here. It, you know, again we’ve got firewalls summaries, traffic by destination port. So again, these are all events coming in that we’re normalizing and summarizing here. Let me jump to the live events. And if you’ll notice that this will continue to scroll as we talk, these are all just events coming on. We’ve got logons, log offs, those types of things. If we did want to find, you know, things that are failing, we can actually apply a filter really quickly here. These are some predefined filters. I can also go build our own, but we can see that these people are trying to log in and failing. So again, these are our people in a zero trust world where people have to log in multiple times throughout the, you know, organization that can only you know, their credentials only lasts so long before they have to log in. Again, you can track these, if things start to, if you start seeing a lot of activity or activity, that’s, we can drill down on here and see a little bit more about this, but we can see the time and the, you know, the source, IP and the destination, you know, you can start to track those things and find those folks that are having problems. Or if there’s someone trying to get in to your, say like a VPN or something, you can actually see those in real time, and aggregate that information. What’s also really cool is this is real time information, but I can also go and look at this data historically. We’ve got a nice histogram up here that tells us about all the events coming in. And again, we’ve got the same type of filtering that we can add on the fly. So, we can look at severity. We can look at the event type, so let’s see, we can load more. I could also go and search. So let’s search for log off, log on, let’s search for failed, would probably be a better one, let’s search for failed. So we’ve got some false authentication. We’ve got continued log-in failures. So we can at any point, drill it on these, drag that up there, click search and wait for that to load. We can see that that’s happened a few times. If we wanna go back and see, there is this a trend, we can go back and do two hours. We can do a certain day, and again, give it a second to, I got to press the search button for it to load. And, you can now see this detail, right? So failed authentication. We can see the IDs. We can see the time. And again, there’s Billy Bob. He’s having lots of trouble logging in on a regular basis here. But again, all of this is here. You can build filters and quickly drill down to whatever information you want, since the data is coming in real time, you know, we can go in and build alerts. We’ve got a bunch of built-in alerts already, but we can build additional ones, if there are specific things that you’re looking for. So here, we’ve got like critical account login failure. If we go in here, we can see just a little bit about how that’s configured, but you can see, you can pick events. You can define, you know, which accounts that you’re interested in, what rule, and you can even, you know, have some filters here to control when you’re alerted and when you’re not. But the idea is like, you can, we’ve got some stuff out of the box, but you can also build these all day long in terms of, you know, what you wanna be alerted on. We can go back to events, but the general idea of in a zero trust environment is, you know, you wanna be watching for these types of events, you wanna be watching when they’re occurring, if they’re occurring more frequently and quickly be alerted on that end and SEM can do all those things. And again, with the nature of it being real time, with be able to watch those USB keys, we really can help you lock down your environment, especially since you have a lot of remote users now, we can monitor this on servers. We also have a workstation option so you can deploy these out too, if you’ve got to people who are suddenly, you know working remotely, you can monitor their desktops as well, so in laptops. So, it really can give you a complete security view of your environment to make sure that you are, you know, you’re able to monitor that to zero trust type of implementation.
Awesome Brian, those are some great use cases. And I think, kind of how you demonstrated there, we know from research that a lot of users, sometimes they’re just well-meaning employees that are maybe putting in a USB key and it didn’t realize that it was unauthorized, but that’s a zero trust is all about, right, making sure that you’re secured your environment from any insider or outsider threats. So, we are going to now pass it over to Dez again, who’s gonna look at NCM and then Brian’s gonna take us through SEM as well. So, headed over to you guys.
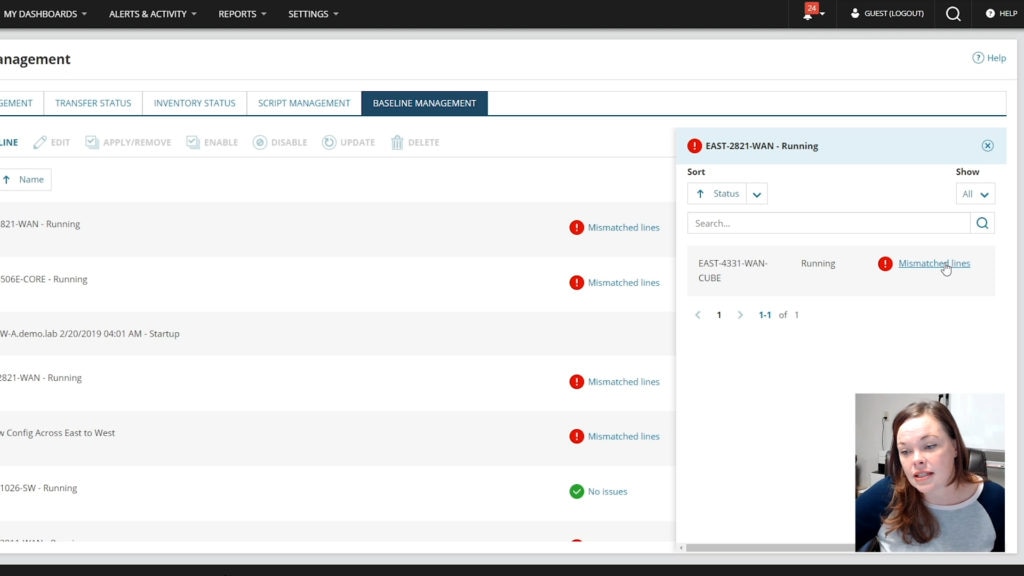
So now we’re gonna go over the Network Configuration Manager and I’m going to show you like how we can actually help assist you with like device trust, your transport trust, application trust and data trust. So, one of the things that we wanna focus in on is if your configurations for your network, that’s where you’re holding all of your information for security and hacks, how you’re actually helping them to either be more secure or not secure, right? So how do we do that with Network Configuration Manager? I wanna go into here and I’m gonna show you some baselines. So, a lot of people with Network Configuration Manager, they get worried about zero trust things called config shift. And what config shift is when we make little changes, little changes, and then everything just kind of starts to fall out of place, right? And it’s like, it’s not a security issue on the first change. It might start to become a low security change on the second change. And then all of a sudden, you end up in this severe or critical area of your configurations and you’re not really at a zero trust anymore. So one of the things that we wanna do is kind of show you what does baseline management look like and show you how easy it is to actually apply it. So when I go into the baseline management, you can see, we have some that are there. And what the great thing is is that it’ll show you like, “Hey, what’s my mismatch lines.” Like what, where are we shifting at? You can alert on this. You can run a report and I’ll show you that in just a moment. But when we want to actually create one, it’s very simple. We can do it as a snippet, or we can do it as a complete config. Now this helps you with network standardization, and with any security level that you wanna work with, network standardization is vital to your company, and this can help you actually make sure that you’re doing that, ’cause you can make sure that you have your SNMP credentials put in, you have your VLANs set up correctly. You have your ACLs that have to be in place. So this is where you can actually make sure, “Hey, we are making sure we have a baseline config. We have our standardization within here. We have our zero trust ACL in here or abilities within here that we are going to actually monitor.” So we can come down here. We can put in our script, we can say, apply this globally. I can choose certain lines. You can grab it from a config that’s already in there, so you don’t have to, you know, revert anything or create your own. You can promote it to a baseline. So we make that functionality really easy for you. And it’s all because we wanna make sure that we’re helping you with your network standardization, of which that you have. So when we create one of these, I wanna cancel out of here real quick and you can assign it to your nodes. I wanna show you what it looks like if something does go awry. So we can click into here and say, “Hey, where’s my mix-match lines?” And it’s going to look very similar to you because it’s like that diff, right? It’s when we do real time change notification. It’s also like when we do, what is the difference between two configs? We’re telling you what has been changed. When we’re focusing in on any type of a security issue, what is the number one thing that everyone asks? What changed, right? What has changed? What has happened? This was secure before, we didn’t have these issues before. We were cleared, but all of a sudden, they’re able to get into here, and it doesn’t make sense. You can very easily see the date and time and we can focus in and say, “Hey, at this time, there was a config shift of which that has happened.” And now we can see exactly what’s changed there. Like here, there’s no platform any it’s everything’s being disabled. We can start to actually go in here and say, “Look, the boot flash is different. “What is happening here?” So this is also something if you have somebody that is doing an inside attack or an outside attack, what are they changing? Where are they going? And you can immediately start to shut them down and revert it back so that we can get things done. Now, when we wanna talk about the reports, I wanna just show you the baseline report because this helps you out when you’re auditing to prove everything of which that’s happening with you. So I’m just going to put baseline in here and do a search. And I can see my baselines right here. I can see, well, Brian’s gonna talk about the server configuration in a minute, but we can also see the NCM one that’s playing a role here. So, I’m just gonna click on it so you can see quickly. And we can say “Hey, we have no conflict on this,” but the other baselines of which we have applied, we have conflicts that are there. So I can drill in quickly and see that. You can schedule this report. You can have this report sent out to you, weekly, daily. However, you’re wanting to do that, we can alert on changes, so it really helps you to stay on top of config shifts as well as an audit trail which I think is very important for everyone to have is, when did things happen? And when can we actually show what we have done or have not done. Now, when we wanna talk about zero trust as well, when we wanna say “Hey, users” or devices themselves, like who’s accessing, who’s touching things, that always comes down to, you have to be more in real time. So for me, what I like to focus in on is real time change events, because there’s gonna be able to help you out and say, who did what? So we can see, like there was a real time change that was actually detected. And this is either by SysLog or traps. And I can see that it was a successful, we downloaded it. We seen that there was an actual change on this device. We can see like somebody uploaded scripts. We can see anything of which that they are doing. And then we can immediately get alerted on this from email, text, anything of which that you’re wanting to do those. And we can actually say what changed, when, and how. And when we’re talking about wanting to be able to allow users access as well as, you know, what do we wanna talk about transport sessions or things of that nature, you’re wanting to make sure you have that network standardization, but also we have pending approvals, so, we can have tears, ’cause your number one issue that you’re gonna have that can actually cause you a lot of security is not that people are vindictive or trying to come after you. It’s fine mistakes, right? Like they accidentally, you know, use the wrong port or they accidentally applied the wrong ACL. Your baselines are gonna help you to stay on top of that, because it’s gonna show you if anything shifted. Compliance reports are gonna help you to mandate it. But then, if you have an approval system, this is gonna help you manage it. Who’s doing what? So when we do the approval system, we can actually view and edit this and you can have through up to three levels. You can have, you know, one person has to check you. Two people have to check you, or two people have to check you in. You have to be checked yourself. So this is going to show me exactly what they’re trying to do before they get it implemented. And you’re saving yourself a lot of time on those fat fingers as they call them, because we don’t wanna make sure that people are making a mistake. You know, you’re accidentally putting it as a hundred megabytes instead of 10,000 or you’re doing it opposite. So we see the script of which that they’re wanting to run automatically so we can validate it. Where are they actually putting this to? What devices are they going to? I can immediately check it to make sure like hey, this is the right script. It looks accurate. This is exactly what I’m looking for. This is what I need. And then that’s exactly where we’re gonna go from there, right? Like then I can approve it. I can do it immediately or I can schedule it. So those are the things that you have to put in together as your approval systems, with your real time change notification. Because if you have an approval system, and then all of a sudden you notice a real time change and it’s a user that’s not in the approval system, shut it down, shut it down immediately, and you’re able to compare those quickly and see like something is out, right? Like something’s wrong, because when the real time change, we will show you a SysLog or a trap however you wanna have it set up. Who logged in, who did what? And so you’ll be able to quickly be able to tell immediately who’s making the changes. And you can verify if they’re actually using the approval system. So all this helps you to actually maintain your security policy, so that you can actually help yourself to stay more aware. So when we talked about realtime change baselines, we’ve talked about the approval system. Now, how do we actually mandate that and to go through, and that would be your compliance. This is how you’re gonna set it in stone. This is how you’re gonna make sure that things are coming across there accurately. And when we go into our compliance reports, you can set these up to match your security policy. They’re 100% customizable. So we can look at here and I can immediately assess a situation. So I can say, I’m running this report. You can schedule these reports in your jobs. You can do an automatic remediation to this if you’re needing to. A lot of people like to do that for their audits as well. But we can immediately say, if we have data only supposed to be on certain ones, or if we have applications and traffic that’s only supposed to be in a certain devices, especially when you’re talking about like SD-WAN or SDN networks, you really wanna make sure that it’s working correctly, right? So we have to make sure that the devices are actually like going to where they’re supposed to be. You can set that up in a configuration report. You can also set up security reports in these for your compliance. And what that’s going to do is help you to match up your zero trust model. It’s gonna help you with device trust ’cause you can prove it. It’s gonna help you with your transport session trust because you can actually apply that for your config and your network standardization. You can do application trust as well because we can validate your application trust from a compliance report, and then also your data trust, right? Because as you’re doing application and or data, you can make sure that traffic is not on the wrong devices by actually doing a compliance report that’s gonna be there. So these are all things that it can accumulate and help back you up for when you’re doing your zero trust model. And something that I really want everyone to focus in on is with automation and orchestration, as well as needing that visibility. SolarWinds has your back on that as we can see from the demos of which that you’ve done in this lab episodes as well, but it’s one of those things if you have to have visibility but insecurity, I can’t stress this enough, you have to back it up and prove it. So you have to maintain your audit reports. You have to be able to know, is there changes? Where’s the change? When did the change happen? Who has access, who does not have access, right? Like these are all things that can help you. And when we’re talking about the zero trust in what everybody’s really worried about, right, is, you know access. As we said before everybody’s wanting to be able to access it from home, we’re remote. I wanted to show you that the power with NCM, as well as your, you know network performance manager and things like that, is that you have things with VPN that we’re able to see on those devices, right, on your firewalls. We can show you remote access. We can show you site-to-site access. This is my favorite report with COVID because we can validate, like, “Hey, are your users logging into it? Are they having a problem?” And if they’re having a problem, I immediately know what protocol, client information in which that they have. When did they try to connect? You know, when did they disconnect? And then also in COVID times, it’s something that we also need to think about is, is somebody pulling down a database, is somebody pulling down information from finance that they’re not supposed to. We would be able to see this information coming across and we would either be able to do it also with the server configuration monitor, we’d be able to see like, you know, Hey, like, you know is there something that’s being changed over there? Or with Network Configuration Manager it’s like, Hey, is somebody changing things? Are we having a config shift? Are we noticing something? And then, I can prove the fact on remote access like how much data are they actually transferring? If I see huge gigabytes of data that’s coming across from somebody that’s in sales, that doesn’t make any sense to me, right? So that’s an immediate something that I can look through here and be able to visualize quickly with these reports that we can help me audit and also get to that meantime of innocence, right? How can I turn this around and figure out what’s happening and how can I quickly keep on top of my network and my applications. And so zero trust helps you set up the framework, but SolarWinds tools help you back that up. Now I would also like to kind of move more into the server side. So I think Brian can actually show us a little bit more on the Server Configuration Monitor side.
Right, thanks Dez, great overview of what we do on the network side. And we do a similar on with SEM on the server and application side. So SEM focuses on collecting data multiple ways. So we can collect data from registry. We can run queries into the Orion database. We can issue commands on the command line, both in Linux and Windows. And then we can also pull data from databases as well. So we have a lot of different ways to collect the data, but we do the same thing that NCM does. We were gonna sit there and pull that data periodically. We’re going to compare it over time. You can set baselines, and we do have some of the real time capability as well. So the idea is like, just like an NCM, you can say, Hey, I’m going to look at my IIS server and I’m going to make sure that I’ve reviewed those configurations. And I wanna track those over time. I wanna set a baseline. I wanna be alerted when those things change because if people are accessing your systems remotely, they could be making changes to configurations. Again, it could be, you know, your database ports. It could be, you know, who’s allowed to see what inside of your web servers, all those types of things. And you wanna be able to track those and be notified of those and know what changed. Not only that there was a change, but what changed. So we could definitely go into like, here’s an IIS configuration change. This is one of the web configs that change. If we drill in here, we’ll get a very similar view that we just saw. And with on the network side here, we can see that there’s been a whole section added to that. So we’re able to quickly view what’s changed there. If we wanted to see if anything else had changed on this particular IIS server, we could do that. And we can see that not only on this server, are we watching IIS, we’re also watching the hardware and the software inventory. So someone updates drivers, if someone installs a new piece of software, if someone upgrades Windows, we’ll actually track that over time. We go back to the summary page. We can also see, these are all the most recent events over here. Here, we also identify other things that you could be monitoring on the servers and go down to the bottom, it’s really long. We’re also getting the configuration events. So you can also do alerting on these as well. A new feature that we just added is compliance. So, if you sort of the last part of the NCM demo, we were doing compliance on switches and routers and those types of things. We can also do that on Windows IIS and SQL Server. So, we can look at these and based on a particular policies like STIG, we can actually come in here and tell you how compliant are you? Are you meeting that compliance? How well are you meeting that compliance, what’s broken? And then you can actually drill down and see, what do you need to fix? We have the remediation steps here as well and we can show you what’s broken there. So the compliance is a new feature that just came out. That gives you even more, you know, more ability to know if you’re meeting your, if you’ve got those types of compliance requirements either internal or external benchmarks that you need to be, you can do that with server configuration monitor as well. Just real quickly on the reports. Everything that you saw there, we like Dez was saying you know, we’ve got the baseline reports, we have compliance reports, we have change reports. And if we go in here and run this, again this is a great report to be able to see what baselines are kind of you know, been broken across the entire environment. So again, you can see the different types of stuff that’s happened here. Software installed, OSF dates, and those types of things. So really quickly, get an overview environment, deliver that to whoever needs that. So that’s a quick summary of what SEM does. Again, one last thing, one of the best things about SEM is that it’s extensible. All those methodologies that you can collect data, you can add. So really the data, the configuration data that you collect is only limited by sort of your own scripting superpowers. If you are really good with PowerShell or with the Linux scripting, you can collect data on almost anything and watch that over time, SEM will distribute that script to all of your servers. And again you can start monitoring, baselining, all that kind of stuff. We don’t really, we’ve got some out-of-the-box profiles and policies, but you can build your own as well. So it’s kind of like anything that you’ve ever wanted to monitor from a configuration standpoint in your environment you can do with SEM. So that’s a quick summary of SEM, really great, a compliment to NCM. If you have to worry about configuration and compliance, you know, and zero trust is a great way to, it really fulfills the zero trust bandaid of being able to track what’s happening to your networks, servers, applications, and databases across your entire environment.
Thank you guys for watching today’s episode. And I hope we’ve taught a little bit more about how SolarWinds can help you with your zero trust security models. And I wanna say a special thanks for Sven as well as for Brian, for them helping us out for demoing and showing you how to really help that out.
And guys, your trust is as easy as it gets. So it’s time to get started with it right now. Start looking at it, start working at it, get your company secured.
Cool guys, thanks for joining. And if you have any questions, don’t hesitate to contact us or write us on THWACK. Have a great day. [upbeat music]