You can learn a lot about an organization by looking at their data. For example, if I see “LoanToValue” (LTV) or “CollateralValue,” I could surmise they deal with financial data—specifically loans—in some fashion.
Developers and database administrators with domain knowledge about the intrinsic meaning of the data are precious friends. These individuals understand the meaning behind the data and how it works within the applications of the organization.
If you’re lucky enough to already understand the data you’re working with, great. But if not, don’t fret! With the proper process and tools, you can quickly learn the story behind the data.
What Does the Data Tell You?
Even if you don’t have domain knowledge of the data, it can still reveal information about what is going on if you know what to look for. For example, suppose you looked at a string representation of a number, like “004567889.” The leading zeroes imply the application isn’t currently padding the real value or isn’t sanitizing the number when a user inputs data into the front-end system. This data should be stored as a true numeric data type (INT, BIGINT, DECIMAL, etc.) within the table.
Usually, this occurs when the database architecture is designed by someone who doesn’t understand the importance of correct data types and who’s attempting to develop the application as quickly as possible at the expense of data architecture. Choosing improper data types can lead to a myriad of problems, including storage capacity problems, performance issues, and downright incorrect data from an application.
Of course, there are exceptions to this rule. Numbers starting with a zero—Social Security numbers or ZIP codes, for example—must be stored in a string data type because the database engine would trim off the leading zeros, leaving you with an incorrect data value.
Studying the data can also give you a rough idea of how data relates to other records in the database. Let us look at the example in Figure 1, which is a subset of data from the sample database AdventureWorks2017 in the Sales.SalesOrderHeader table. Notice the column ShipToAddressID is an identification (or ID) value of some sort. The lack of a normal address here suggests there should be a corresponding table to handle the Ship To addresses for each order. If this wasn’t the case, this data wouldn’t be useful since a valid shipping address requires more information like country, state, house number, street, postal code, etc.
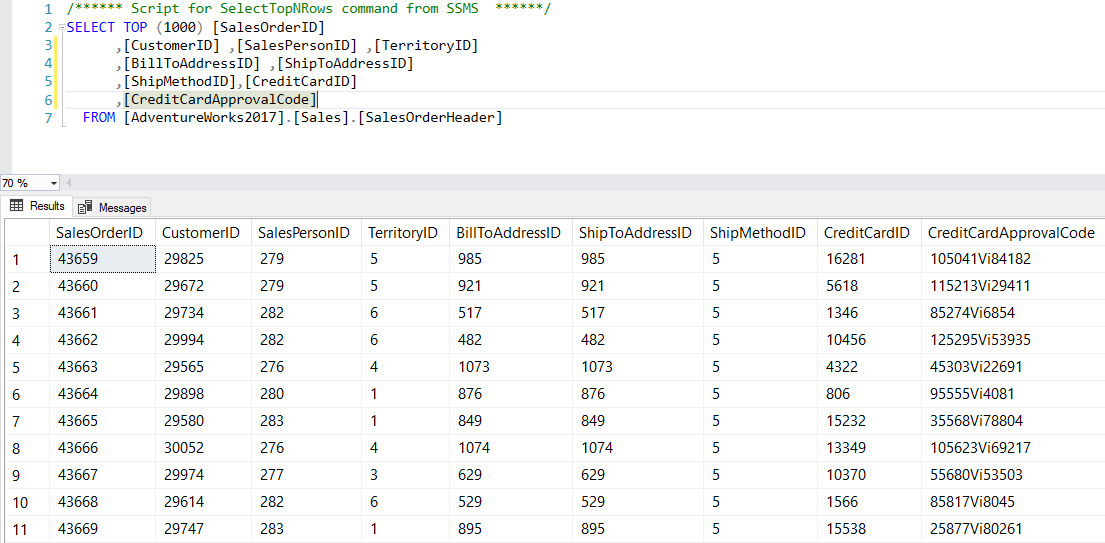
Figure 1 – Data can tell a story
What Does the Data Not Tell You?
Data doesn’t usually tell you what it means. While you can read the values themselves, data is sometimes meaningless without context. Using the previous LTV example, if the LTV value was equal to .80 (or 80%), the number 80% is useless unless you know the value represents loan-to-value. LTV is the total dollar amount of the loan divided by the cash value of whatever collateral secures the loan. With that background, we can determine 80% of a $125,000 loan requires a collateral value of $100,000.
LTV = $125,000 / $100,000 = .80 or 80%
If you’re new to working with data, drawing inferences from the data like this will come with time and experience. As you explore more diverse industry systems (meaning financial, aviation, health care, technology, etc.), you’ll see similar data elements and patterns begin to appear regardless of the sector.
Behind the Eight Ball
As a consultant, I regularly jump into client environments where I have zero domain knowledge of their data. At times, when this happens, there’s a critical event ongoing (like the Production database server is down), and I must quickly and effectively figure out what’s happening to resolve the issue. Sometimes this is hardware-related, while on other occasions, the problem is data-related.
Without domain knowledge, I’m behind the eight ball. I must now play catch up. This catch up can be done in a couple of different ways: I may ask someone else about the data and hope they know, or I can use some type of tool allowing me to explore on my own. Choosing which tool to use comes with experience and with understanding the environment and individuals in play.
For example, my colleague and I recently tag-teamed a data issue for a client experiencing a problem with how they bill their customers. Ensuring the client’s customers were billed accurately is obviously a critical task. In this case, we attacked it both ways: by getting the client on the phone while at the same time exploring the data on our own. Because of the critical nature of the issue, this allowed us to be as effective as possible in helping to resolve the problem quickly.
Let’s talk about the pros and cons of each option.
Ask Someone Else
Asking someone else can be difficult at times, especially when you’re supposed to be the expert. However, a bit of insight from someone who already understands the data can go a long way. So especially when time is of the essence, it pays off to check your ego and start asking questions. Oftentimes a couple of sentences can explain what it would take minutes or hours to discover with tools.
A downside of asking someone else is, unless they know the relationship of the data (how the data interacts with other data), this could be a lost cause. If they don’t have the domain knowledge either, then you’re effectively barking up the wrong tree. Worse, they could give you misleading information, making the situation worse.
Use a Tool
Using a tool is a quick way to see the data holistically. It’s also faster than having to bug someone and wait for a reply. After all, they might be busy with other things, and it might be hours or days before they get back to you. SQL Server Management Studio (SSMS) or Azure Data Studio are great free tools to help you go spelunking through the data.
Something the tools may not do is illustrate how data relates to one another in an easy-to-understand format. Yes, you can create a database diagram with SSMS, but it doesn’t necessarily show you the physical relationship a data element may have with data in another table. You can derive the foreign key relationship from the diagram, but all that tells you is these two columns have a relationship.
Visualize Your Data Universe
Managing the data universe for any system of record can be cumbersome, but it’s a task most database administrators should do. Even consultants, such as I, must go through the routine of trying to understand the data—especially when a client is having an issue affecting production.
When you start researching tools to help explore data, look at the free tool DBA xPress. The included Data Surf tool in DBA xPress can help provide the necessary visibility into your data, helping you to explore the data universe and everything it has to offer.
To get started with a free download, click here. See for yourself what it can do for you.