We often get questions about how we measure queries inside MySQL (and now
PostgreSQL too). Many of these questions reveal assumptions about the metrics we provide and our methods for obtaining them. I thought it would be both interesting and helpful to clarify how we really do this. This article may get a bit dense, but by the end you will have a better sense of our database management platform’s unique approach.
SolarWinds
® Database Performance Monitor (DPM) is a complex system that captures and analyzes several different types of data. It’s not solely one thing or another. The magic comes from the intersection of the various useful kinds of data:
- Unlike database monitoring tools that simply draw graphs of status counters, SolarWinds DPM measures queries the server executes.
- Unlike log analysis tools that just aggregate queries along one dimension, SolarWinds DPM measures multiple dimensions about each family of queries and can slice-and-dice and aggregate queries along any of them.
- Unlike tools that measure the database but not the operating system, How SolarWinds DPM Measures Queries or the OS but not its processes, and so on, SolarWinds DPM measures all of these.
- Unlike systems that are built for metrics, SolarWinds DPM stores both metrics and samples — individual occurrences of the events from which the metrics are derived.
In this post we’ll focus on queries and their various dimensions, leaving aside all the rest (which is quite a lot). The query metrics are perhaps the easiest to understand, so let’s take a look at that first.
Metrics SolarWinds DPM Captures About Queries
SolarWinds DPM observes every query or other request to the server and measures various things about it, including its response time, errors it generates, rows affected, warnings generated, and various facts about it such as the connection’s current database, the user, and the remote host. We also analyze the SQL or other text/command about the request, and categorize requests into families based on the result. Finally, we analyze user-injected metadata in the SQL, such as embedded name-value pairs inside comments.
SolarWinds DPM generates periodic metrics about these requests, mostly by accumulating counters. For example, we accumulate a counter per family of query for response time, count of query, count of errors, and so on.
We measure all of our database monitoring metrics in industry-leading 1-second resolution. Our agent generates these high-frequency metrics by sampling from the accumulated counters once per second.
The result is high-dimensional metrics about each query family. In other words, we generate lots and lots of metrics each second per query family, depending on its characteristics.
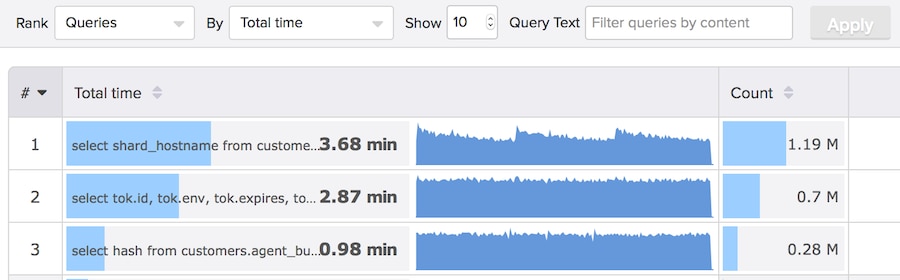
Let’s look at our Top Queries feature as an example. The following screenshot shows several kinds of metrics about queries. There are three query families, and we’re ranking top queries by the total time. The blue bars in the Total Time column are generated from the sum of the
time_us metric from each query family. The blue sparkline graph in the middle is generated from the same metric, but instead of being the sum of the metric, it is the metric resampled to a resolution that’s appropriate for the time range selected (in this case, 3 hours). And the Count column comes from a count of query executions (throughput), which is a different dimension we measure about the query families.
An aside: There are big differences between status counter metrics from e.g. SHOW STATUS, and metrics derived from query activity. Most database performance monitoring and metrics systems are not capable of handling the type of metrics SolarWinds DPM stores and computes. They are very high-cardinality and may be sparse. A system like RRDTool, which allocates a fixed-size RRD file per metric or group of metrics, assumes dense metrics that are known beforehand and are not dynamically appearing and disappearing. This is not the case for SolarWinds DPM. We get tens of millions of distinct kinds of metrics from some of our customers’ hosts. It would never work to use something like RRDTool or Graphite for our backend storage. I gave a webinar about our time-series database that goes into some details.
How SolarWinds DPM Captures And Measures Queries
How exactly we observe the queries in the first place is another common question. There are various ways to do this. All of them have some drawbacks and there is no perfect solution:
- Make the server write all queries to a log and analyze that log.
- Periodically poll a command that shows executing queries, such as
SHOW FULL PROCESSLIST in MySQL.
- Use a built-in system like
pg_stat_statements in PostgreSQL, or PERFORMANCE_SCHEMA in MySQL.
- Capture TCP network packet data and extract queries with libpcap or similar, like
tcpdump does.
I wrote about this in some detail at
Performance Schema, Slow Query Log, and TCP Decoding. The short version is that we believe the TCP capture approach is the best overall. We measure queries from first-inbound-byte to first-outbound-byte and use the latency as the measure of response time. We also decode requests and responses to get things like protocol flags and errors.
We do
not poll commands like
SHOW FULL PROCESSLIST, which are dangerous and miss a lot of important information. We also do not “sample” a subset of the traffic to make inferences, although we
recently added the ability to do partial network capture in case full capture is too much overhead.
Metrics Are Not Enough, You Need Samples
In a perfect world, we’d measure and record each and every query that executes in your systems. However, at scale this just isn’t feasible. Generating descriptive metrics about those queries, in fine-grained categories and along many dimensions at high resolution, is a less costly way of doing nearly the same thing. A server doing 50,000 queries per second will generate far fewer than 50k metrics per second because we’re accumulating a lot of those queries together.
However, metrics alone aren’t enough. You can’t understand and optimize queries if all you have is a metric that says “queries like this one behaved like this-and-such metric during this time range.” You need individual samples of the queries, too.
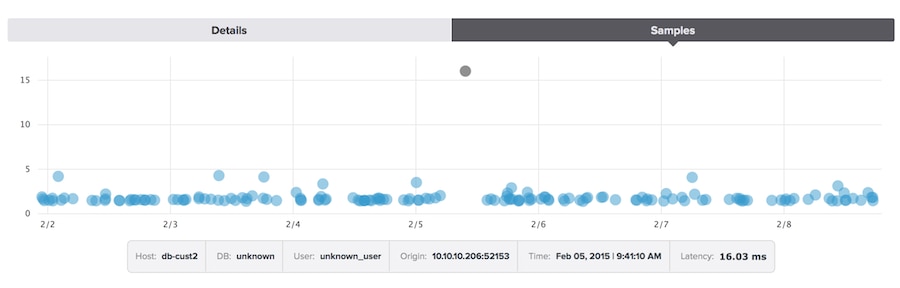
Combining detailed metrics about families of queries with samples of individual executions gives a much better picture. We capture samples from each family of queries and record those verbatim at intervals. Looking at these lets you see exactly which facts we knew about that individual query, such as its timestamp, user, database, origin host and port, and so on. Most importantly, you can see its SQL and its
EXPLAIN plan.
If I select the top-ranked query in the screenshot above and click into it, I can see the samples. By clicking on each sample’s dot on the scatterplot, I can view its individual details,
EXPLAIN plan, and the like. These samples not only give me something I can actually use to optimize the query, but the scatterplot gives a good overview of query behavior that doesn’t necessarily come through in the metrics shown in the Top Queries table.
Note: “Sample” is a confusing term because we just said we don’t “sample” queries. In the sense of gathering individual examples and recording them, yes, we do. In the statistical sense of collecting a small sample from a large population and trying to infer things about the population from the subset, we don’t, or at least we don’t exclusively do that, since we do capture and measure every query in the population. Sorry, I know this is confusing, but there don’t seem to be better words.
How we decide which samples to capture is the subject of an upcoming blog post. It turns out it is a hard problem to do well. The usual “worst sample per period” thing I’ve done in the past, with the various log analysis tools I’ve written, is not very good when you stop and think about it. But this is a complex topic I will not dive into here.
There are also a lot of other subtleties. For example, we have to
reconstruct pseudo-SQL from prepared statements. This makes them possible to
EXPLAIN and otherwise analyze in query form.
Samples Plus Metrics
Approaching high-volume datasets is always hard. Even if it were feasible to just record every single query as-is and do ad-hoc slice-and-dice analysis on it afterwards, the volume of data is so large that it would just be unapproachable. Distilling all this data down into high-resolution, high-dimensional metrics makes it tractable and preserves most of the interesting features. Capturing individual queries colors in the details that get washed out in the process of metric-ifying everything. In conclusion,
- Metrics describe the query behavior overall, but not individual queries
- Samples describe individual queries, but not the population overall
- Combining the two gives a good picture from a variety of angles
In the future we’ll also annotate everything with yet another angle on the data, arbitrary “tags” or facts that we know about families of queries. This will provide an even richer slice-and-drill-down capability.
As always, we love hearing from customers and prospective customers. Your ideas and feature requests keep us busy making things better. And if you haven’t looked at SolarWinds DPM yet, now’s the perfect time to sign up for a
free trial of Database Performance Monitor and see what you’ve been missing. One thing is sure: within a few moments you will learn something about your systems that you didn’t know.