 Our servers have skip_name_resolve set, so it usually only takes a few hundred microseconds to accept an incoming connection and send out the initial handshake packet (the latency will be higher if your server has to do DNS resolution for a client connection). You can see that every once in a while this latency will jump to a few milliseconds - this is likely a result of the database being busy processing a query, so it takes a little longer to respond to the client connection. If the latency spikes higher to hundreds of milliseconds, then it could be an indication that the server is under heavy load or there is a problem with DNS resolution.
For our customers who are eager to check the connection latency of their MySQL servers, you can find the connection latency graph under the ‘MySQL’ category on our Charts page (note that this feature is not available if you are monitoring remote MySQL instances as it relies on TCP sniffing). As always, be sure to let us know if you have any feedback, and enjoy!
If you are not yet a customer, sign up for free trial to see connection latency and so much more.
Our servers have skip_name_resolve set, so it usually only takes a few hundred microseconds to accept an incoming connection and send out the initial handshake packet (the latency will be higher if your server has to do DNS resolution for a client connection). You can see that every once in a while this latency will jump to a few milliseconds - this is likely a result of the database being busy processing a query, so it takes a little longer to respond to the client connection. If the latency spikes higher to hundreds of milliseconds, then it could be an indication that the server is under heavy load or there is a problem with DNS resolution.
For our customers who are eager to check the connection latency of their MySQL servers, you can find the connection latency graph under the ‘MySQL’ category on our Charts page (note that this feature is not available if you are monitoring remote MySQL instances as it relies on TCP sniffing). As always, be sure to let us know if you have any feedback, and enjoy!
If you are not yet a customer, sign up for free trial to see connection latency and so much more. See Connection Latency with SolarWinds
February 26, 2015 |
Database

Recently, one of our customers reached out to us about a problem they were having trouble diagnosing - they noticed that every once in a while, it took their MySQL server a few seconds to initialize a client connection. They had figured out that the issue was a missing hosts entry for one of their clients, but SolarWinds® Database Performance Monitor (DPM) didn’t have any measurements to show this issue to them.
We always enjoy getting customer feedback, and in this case we saw a clear need for something that DPM was missing. To address this shortcoming, we’ve recently added the ability to see the connection latency for newly established connections against your MySQL server!
Connection latency can be a real problem for MySQL; there are plenty of documented cases of server configurations causing serious performance issues for users (see here for example). It’s also fairly easy for us to measure. Since we monitor metrics on database performance through packet-sniffing, measuring the latency is just a matter of identifying the client’s SYN packet and the server’s responding handshake packet. The resulting measurement covers the time it takes for the server to accept the incoming TCP connection and return a handle, then do a DNS lookup on the client address (unless you have skip_name_resolve set in your configuration), and respond with the MySQL handshake packet.
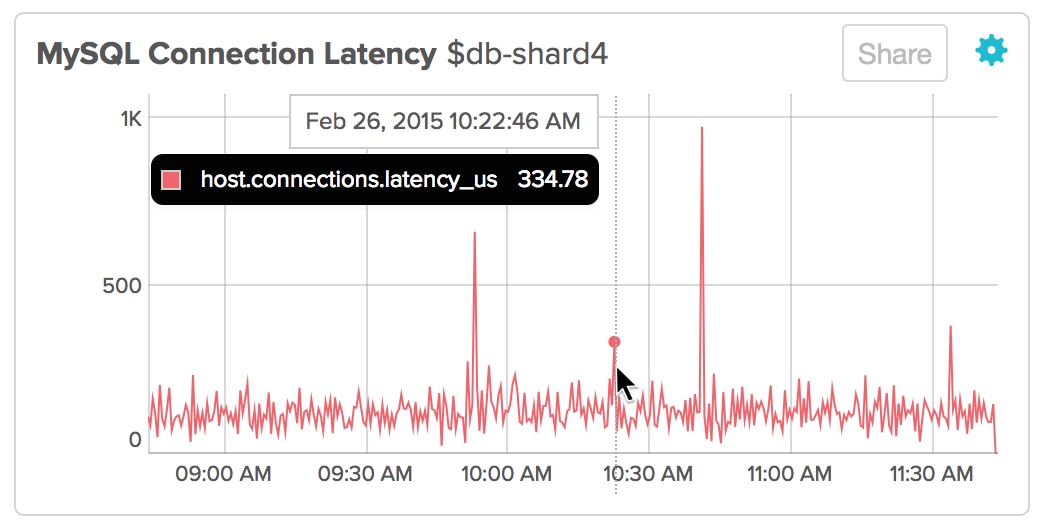
Below is an example of the view:
Our servers have skip_name_resolve set, so it usually only takes a few hundred microseconds to accept an incoming connection and send out the initial handshake packet (the latency will be higher if your server has to do DNS resolution for a client connection). You can see that every once in a while this latency will jump to a few milliseconds - this is likely a result of the database being busy processing a query, so it takes a little longer to respond to the client connection. If the latency spikes higher to hundreds of milliseconds, then it could be an indication that the server is under heavy load or there is a problem with DNS resolution.
For our customers who are eager to check the connection latency of their MySQL servers, you can find the connection latency graph under the ‘MySQL’ category on our Charts page (note that this feature is not available if you are monitoring remote MySQL instances as it relies on TCP sniffing). As always, be sure to let us know if you have any feedback, and enjoy!
If you are not yet a customer, sign up for free trial to see connection latency and so much more.
Our servers have skip_name_resolve set, so it usually only takes a few hundred microseconds to accept an incoming connection and send out the initial handshake packet (the latency will be higher if your server has to do DNS resolution for a client connection). You can see that every once in a while this latency will jump to a few milliseconds - this is likely a result of the database being busy processing a query, so it takes a little longer to respond to the client connection. If the latency spikes higher to hundreds of milliseconds, then it could be an indication that the server is under heavy load or there is a problem with DNS resolution.
For our customers who are eager to check the connection latency of their MySQL servers, you can find the connection latency graph under the ‘MySQL’ category on our Charts page (note that this feature is not available if you are monitoring remote MySQL instances as it relies on TCP sniffing). As always, be sure to let us know if you have any feedback, and enjoy!
If you are not yet a customer, sign up for free trial to see connection latency and so much more.