We've all been there. You place a lunch order at a restaurant, speak for a while with your dining companions, then someone at the table realizes it's been a while since you ordered. The waiter is nowhere to be found. The problem — late food — is the issue for you, not why it is late. You could care less whether the kitchen is slow or the waiter is leaving the plates stacked up under heat lamps. The results are the same — no food.
It is the same when employees sit down at a computer. They are not thinking about how anything on it works, just that it should work, and work fast. A decade or two ago, they might have blamed poor performance on a slow or unreliable PC, but these days most employees have enough computing power on their desks to power a deep space mission. In an environment when more and more productivity applications live in the Cloud or on a server in a remote corporate data center, the network really is the computer. When employees experience latency on a VoIP call or can't access Salesforce.com, they see it as a service not delivered on time, just like diners impatient for their food. But in this case, they sum up the problem with one word: bandwidth. Clearly, this crummy corporate network isn't providing the bandwidth they need to get their work done. Isn't it obvious?
Not so fast. Bandwidth is only one aspect of network performance and only one of several factors to look at when figuring out why a networked application is not performing well. In this paper, we will identify three components of network performance to look at when you get a demand for more bandwidth. The first and most obvious is the raw capacity of your network and how much of that bandwidth is being used. To know whether it is being used efficiently, you also need to look at which applications are generating the most traffic and between what endpoints. If the answer still eludes you, you may need to go to a deeper level of traffic analysis, looking at the speed and timing of the delivery of specific packets of data.
We cover those three techniques in more detail below. But first we should return to the topic of bandwidth. To non-technical employees and managers, bandwidth is synonymous with network performance. What we mean by bandwidth is the capacity of a network link to transmit information, expressed in bits per second. That's certainly one major determinant of network performance, but often an even bigger one is how efficiently that bandwidth is used. In most cases, unless you know that you have severely underinvested, bandwidth is not the problem, and increasing bandwidth will not solve it. You can easily wind up wasting your company's money on an expensive upgrade with no positive result, except that now more employees will discover the added bandwidth and start streaming Pandora. In that case, you would be like the restaurant manager who fires the waiter over complaints of slow service when really the problem was in the kitchen. Your issue might revolve around any number of things: an application that is not configured optimally, daisy-chained network devices that require too many hops, devices that report on their status too frequently, or even a router that is constantly restarting due to power surges.
Whatever the problem is and wherever it lies, you want to solve the problem, not make excuses. Lecturing users on the intricacies of the network and all the possible causes or performance issues is not productive, either. If they say the problem is bandwidth, nod and smile. Understanding the precise nature of the issue is your job, not theirs.
So, when the inevitable bandwidth complaint comes in (maybe at 4:55 p.m. on a Friday before a three-day weekend), where do you start?
What Else Could It Be?
Not everything that looks like a bandwidth problem to end-users or the boss really is a bandwidth problem. In fact, most of the time, it's not. That is, buying more bandwidth may not be the best or most efficient way of addressing complaints about poorly performing networked applications. More often than not, it won’t even solve the problem.
If lack of network bandwidth really is a problem, you would expect performance to suffer for all applications. If that is not the case, poor network configuration may just as likely to be the cause.
Bandwidth Frittered Away
An international firm's China office reported what seemed to be a pervasive bandwidth problem despite a substantial investment in network capacity. Using SolarWinds products to diagnose the problem, the firm mapped out the applications consuming that capacity.
In reality, this firm had plenty of bandwidth available. It was just using it inefficiently.
Once consumption of bandwidth by all applications was analyzed, one application stood out: Syslog. Network equipment across the organization had been configured to log so many routine activities that generated Syslog messages were consuming 90% of all available network bandwidth. Although Syslog can be useful, it's normally enabled selectively because it is extremely chatty. In other words, it generates log messages on a continual basis, which ends up being millions of messages per hour in active networks. These messages were being transmitted to two different servers in the United States, plus a 3rd-party security monitoring service. Most of this logging served no useful purpose.
This turned out to be a standard configuration for network equipment across the organization, meaning Syslog was turned on just about everywhere. That meant it was also impairing performance of systems within the United States, where the effect wasn't as obvious.
The solution: filter the log data locally, whittling it down to only what was useful for security or other necessary monitoring. Transmit one copy across the Pacific from China to the United States and then redistribute it to the multiple locations where it must be stored and analyzed.
The important point to take from this example is that before you decide whether a bandwidth upgrade is required, you need to know how it is being used or misused. In this case, the key was graphing bandwidth use per application. Once that was done, Syslog stood out like a sore thumb.
The Right Tool for the Job
The solutions to bandwidth complaints are often obvious, once you know where to look. So how do you know where to look? Once you have a picture of activity across the network, that's often obvious, too. To see what is going on, you need a network monitoring tool that will let you visualize the flow of bandwidth and spot bottlenecks at a glance.
Visualization is also important as a tool for communication with management when the time comes to communicate the need for a decision. Once the Syslog configuration error was discovered, resolving the issue didn't take a long conversation. The graph showing 90% of WAN bandwidth being consumed by that utility said all that needed to be said. All that was left was:
"So I guess you should turn that off?"
"Yes, sir. Right away."
As a result, our client avoided the costly mistake of investing in an unnecessary network upgrade.
Standard monitoring protocols such as Simple Network Management Protocol (SNMP) and NetFlow™ make the raw data needed to diagnose problems readily available. Contrary to our Syslog example, properly configured diagnostics do not add significant overhead to network performance.
SNMP provides essential network device information, including bandwidth utilization. Typically, you can learn all you need to know by fetching 15 kilobytes of data every 5 to 15 minutes from each monitored device. That's insignificant on the scale of today's networks. In the context of bandwidth analysis, you would use SNMP to determine how much data is being transmitted over a network interface.
NetFlow, developed by Cisco
®, and other flow-based monitoring technologies (Juniper J-Flow™, IPFIX, sFlow
®, Huawei NetStream™), are built into most modern routers and can show which applications are using the most bandwidth and where the most active conversations are. NetFlow identifies applications by protocol, for example, distinguishing between voice, email, and web traffic. NetFlow also lets you track the back and forth conversations between endpoints, such as PCs and servers, and even services such as YouTube and Google. In addition to pinpointing problems with corporate applications, this is one way of identifying unauthorized uses of corporate bandwidth. Lack of diagnostic data is rarely the challenge. Making sense of it is.
Yes, of course, network engineers and architects must understand the basics, including how to diagnose problems with simple command line tools and open source utilities. However, in all but the smallest networks, that is not enough. In addition to being time-consuming, working with low-level tools only gives you one small part of the puzzle at a time. You then must build a mental model of how they all fit together. Unfortunately, the human brain doesn't scale to encompass large data sets. That's why we have software.
A good network monitoring tool gives you a broad overview of the health of your network, highlights trouble spots, and lets you drill down to lower levels of detail as needed. Then you can be proactive about spotting emerging problems and taking action before users start to complain. You can't do that with command-line utilities and Perl scripts.
How do you know when the issue really is bandwidth?
In most cases, you should not leap to the conclusion that more bandwidth is required without a thorough investigation in which you profile how bandwidth is currently being consumed.
Usually you know when you really do not have enough bandwidth provisioned to a specific location. Maybe you have a remote office in a rural part of Africa making due with a low-capacity satellite connection. There's a real bandwidth issue here, but it's not a surprise.
When planning for a bandwidth upgrade for any location, historical network use is one important input to your calculations. Keep in mind, though, that the availability of more bandwidth will probably drive additional network use as employees discover they can take advantage of applications that didn't work well over the old, underserved connection.
When planning capacity for a new location, such as a new bank branch, looking at the bandwidth requirements of several other existing branches of similar size and service area can be a good start.
If you are monitoring network performance on an ongoing basis, planning for an upgrade should never be a crisis. You should be able to spot trends suggesting the need for an upgrade far in advance.
3 Steps To Diagnosing Bandwidth Complaints
Now that you have identified the weapons in your arsenal, here is how to deploy them. You can understand what's really going on with your network bandwidth in three steps:
- Analyze SNMP data for your network links. If they really are saturated, that should be obvious. If you are getting complaints from a location that has a 10 Mbps WAN circuit and only 3 Mbps of usage, then clearly the WAN is not overloaded and something else must be going on.
- Listen in on conversations. No, we're not really suggesting you spy on everyone. But if network usage is exceeding capacity, it's important to understand how it is being consumed. You don't have to snoop into the content of the messages to see who is talking to whom. In networking, a "conversation" is a series of requests and responses, such as the request for a web page and the data returned by the server. Most networking devices make this conversation data easily available using NetFlow.
- Look deeper into application behavior. Identify the applications consuming the most bandwidth and how they are being used. You can start by looking at Internet Protocol port numbers as an indicator of applications in use — for example, UDP port 514 for Syslog. A more sophisticated analysis would include deep packet inspection, which gives you more information about the protocols in use, the nature of the content, and the timing of the delivery of those packets.
Those are not necessarily sequential steps, but they are the three basic components of bandwidth analysis. With the help of a good monitoring tool, you should be able to look at all three in rapid succession. If in Step 1 you confirm the existence of a bandwidth capacity problem, Step 2 and Step 3 become important for pinpointing the source.
You might find that Fred Mendez in accounting has been downloading an entire season of Orange Is the New Black during work hours, and that's the real reason his colleagues haven't been able to access the financial data warehouse at just the time when they need to close the books for the month. (You wouldn't want to be George when his boss finds out.)
Or maybe a router, switch, or some other critical component in the chain is failing and only performing at a fraction of its rated capacity. Replace it, and everyone is happy again.
On the other hand, suppose you establish that the network is performing as designed and the vast majority of the bandwidth is being consumed by employees trying to get their work done. You can't ask them to do less, so the network needs to do more. Fortunately, you now can present all the data to whomever has the power to authorize the necessary bandwidth upgrade, or the addition of a caching appliance, or other remedial measure.
A variation on this three-step process would be investigating the use of the wrong kind of bandwidth — as in unnecessarily expensive bandwidth. Here is a silly, but real, example.
A Fortune 500 company had worked with a cellular carrier to provide backup coverage for its WAN when service from its regular landline circuits was interrupted. The carrier equipped every router with a cellular network card so it could fail over to the wireless network when necessary and revert to the primary connection as soon as the outage passed. However, monitoring showed that the more expensive wireless connectivity was being used far more regularly than it should have been.
Once the network manager confronted the carrier with the analysis, the problem mysteriously went away, and the expense related to wireless connections dropped by 90%.
Besides saving you grief, proactive network monitoring can save your company real money.
How SolarWinds Network Bandwidth Analyzer Pack Pinpoints Problems
Now that you know there is a problem somewhere on the network, how do you find the real issue quickly on a multi-site, potentially multi-national network?
The fact is, you can use tools that come with your hardware or that are available free, but they only take you so far. For example, Wireshark, which is a free, open-source packet analyzer, reports out tons of data in real time, but it will be up to you to make sense of it. (SolarWinds offers a free utility that can help.)
Unless your network is very small (say, five servers or fewer), or your brain is very big (capable of memorizing the state of every piece of equipment and visualizing the connections between components), you really need more than that. You need to proactively monitor your network with a tool that produces usable charts and graphs in real time. That not only gives you a better understanding of your network's performance, but also a visual snapshot you can take to decision makers in your organization when changes or additional investments are required.
The
SolarWinds® Network Bandwidth Analyzer Pack offers comprehensive network bandwidth analysis and performance monitoring. This robust set of tools will:
- Detect, diagnose, and resolve network performance issues.
- Track response time, availability and uptime of routers, switches, and other SNMP-enabled devices.
- Analyze and monitor network bandwidth performance and traffic patterns.
- Identify bandwidth hogs and see which applications are using the most bandwidth.
- Graphically display network performance metrics in real time via dynamic interactive maps.
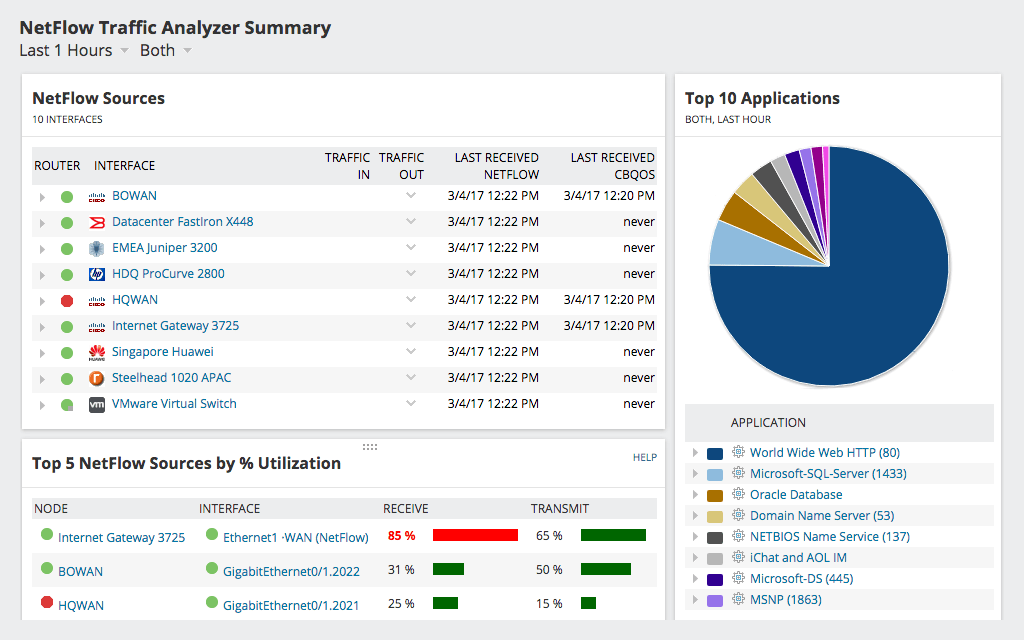
The screen below shows the summary screen of the NetFlow™ component of the Network Bandwidth Analyzer Pack. This screen shows a network performing at an optimal level. If any source were experiencing problems, the green dots switch to yellow or red, depending if the source is slow or down. You can drill down as far as you need to find the ultimate source of a performance issue.
To test the value of the SolarWinds Network Bandwidth Analyzer Pack against your own live network, you can download a
fully functional 30-day free trial.
If you can quickly identify the real culprit behind bandwidth complaints and solve them, you will:
- Make others regard you as a genius and lifesaver.
- Potentially, save your company money by avoiding a needless bandwidth upgrade (no matter how eager your telecom provider is to sell it to you).
- Take it easy on that three-day weekend.