In this post, we analyze some performance issues we recently fixed in our web app common in AngularJS apps. We also discuss the tools we used to find and diagnose the causes and the strategies we used to fix these problems.
The Basics
The average web developer might not pay too much attention to performance when writing code. Memory and CPU are so cheap nowadays, a badly performing piece of code might hide for some time because your browser encounters and copes with it. Furthermore, you might sometimes find yourself micro-optimizing or fixing a problem before it actually manifests as one.
If this rings true for you, then, at some point in the life cycle of a big AngularJS project, you'll get to a stage where you'll run up against a bad UI performance problem... and your weekend plans will be busted.
What you might think are micro-performance problems can turn into major issues in AngularJS apps due to
dirty-checking. Once you understand this, you'll never think you're micro-optimizing again.
The Problem
Some of our customers reported lag in the hosts selector of our web app. Since we have all the data needed for filtering hosts locally, this was no doubt a UI performance issue. Our initial idea was to search for memory, events, or nodes leaked, or slow iterative or recursive code recently added and could be optimized. Moreover, our instinct told us to go search for the problem inside the hosts filter component itself.
While our gut feeling might be right in some cases, in an Angular app, other causes are more likely.
Looking more closely, we found another place where UI lag had started occurring at the same time:
The Profiler Tool.
When you move the mouse over the metrics charts, Database Performance Monitor shows the values at the relevant, viewed point. We do this not only in the chart you are hovering over, but in
all charts on the screen at the same time, so you can see all values at the time of interest, in any of the displayed metrics.
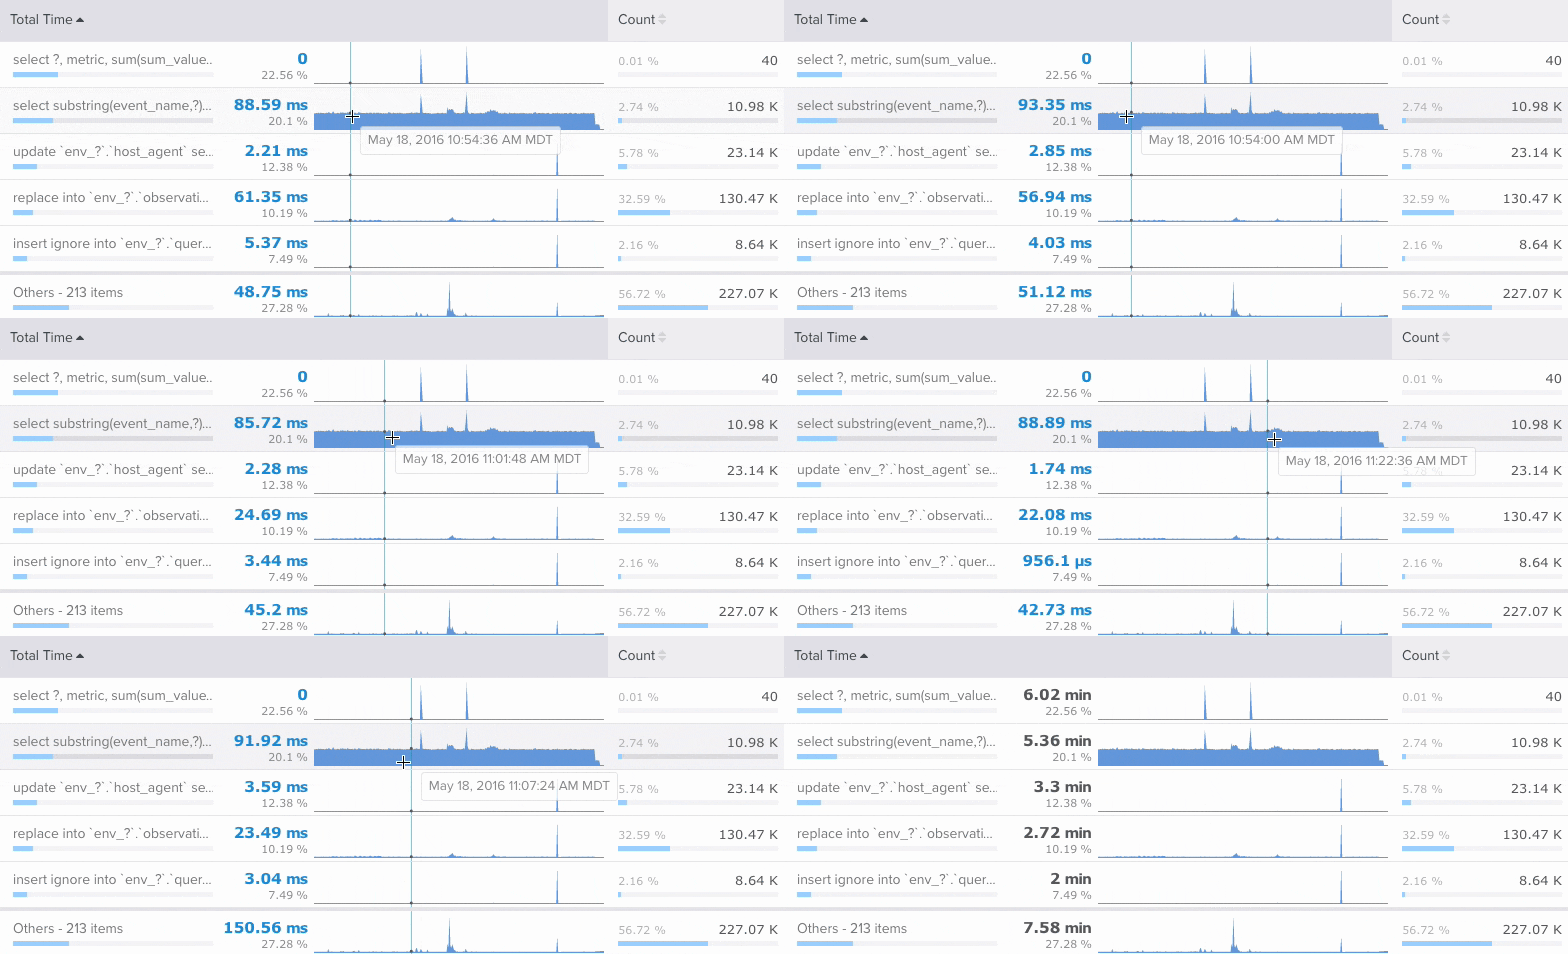
The animation below shows what this looks like when the system is struggling to keep up and there's a delay -- notice the lag. (The gif at the bottom of this article shows how it looks at full speed!)
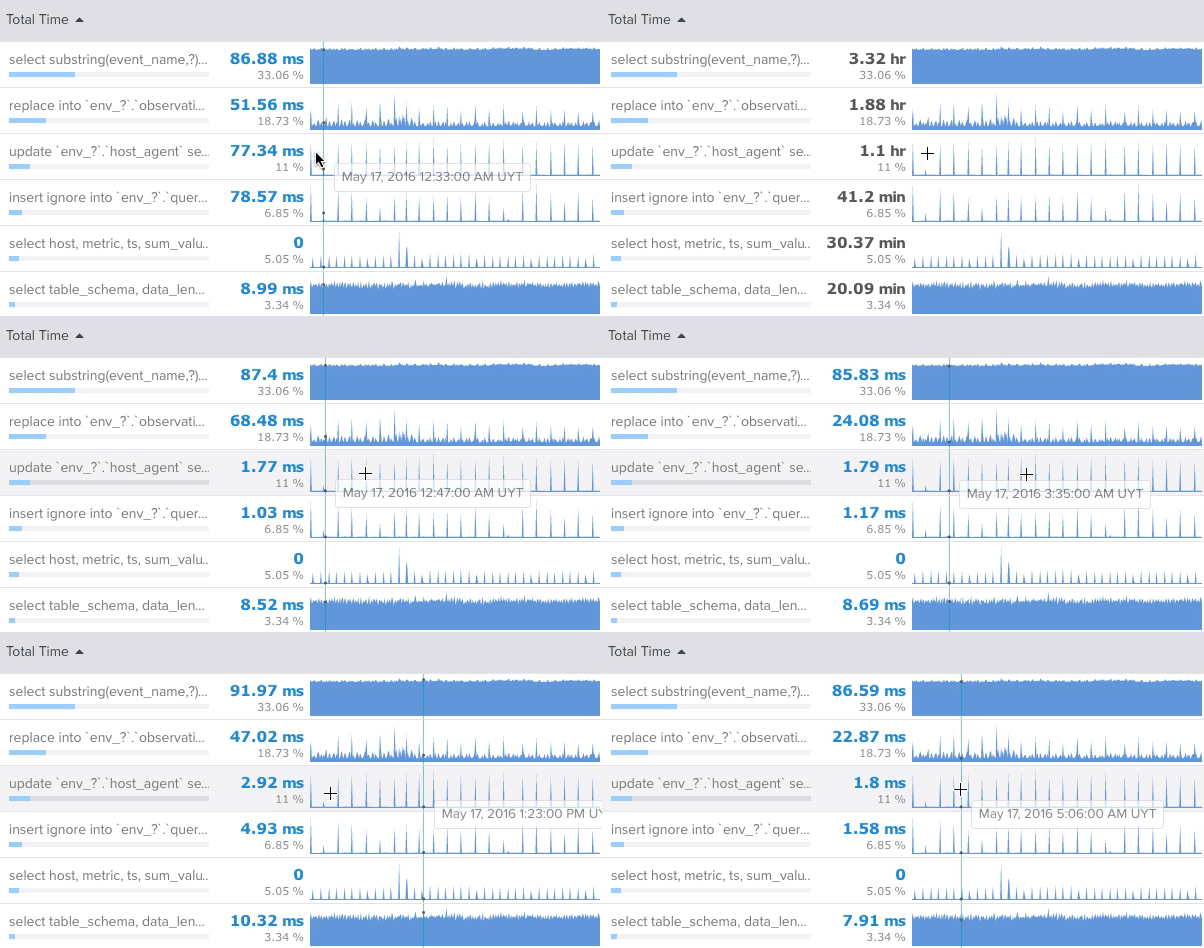
As you can probably guess, this behavior relies heavily on the power of Angular, which is constantly watching the given timestamp and updating all displayed values when it changes.
Timing these features using the
performance api, we found none of them had clear performance issues themselves. We could see the hosts filtering and the metrics hovering working fine in most situations. But in some cases, both would start showing lag.
The Profiler tool shows a lot of information on the screen. You can rank up to 50 queries and toggle ON for more than 20 columns, each of which contains one bar chart and two numbers.
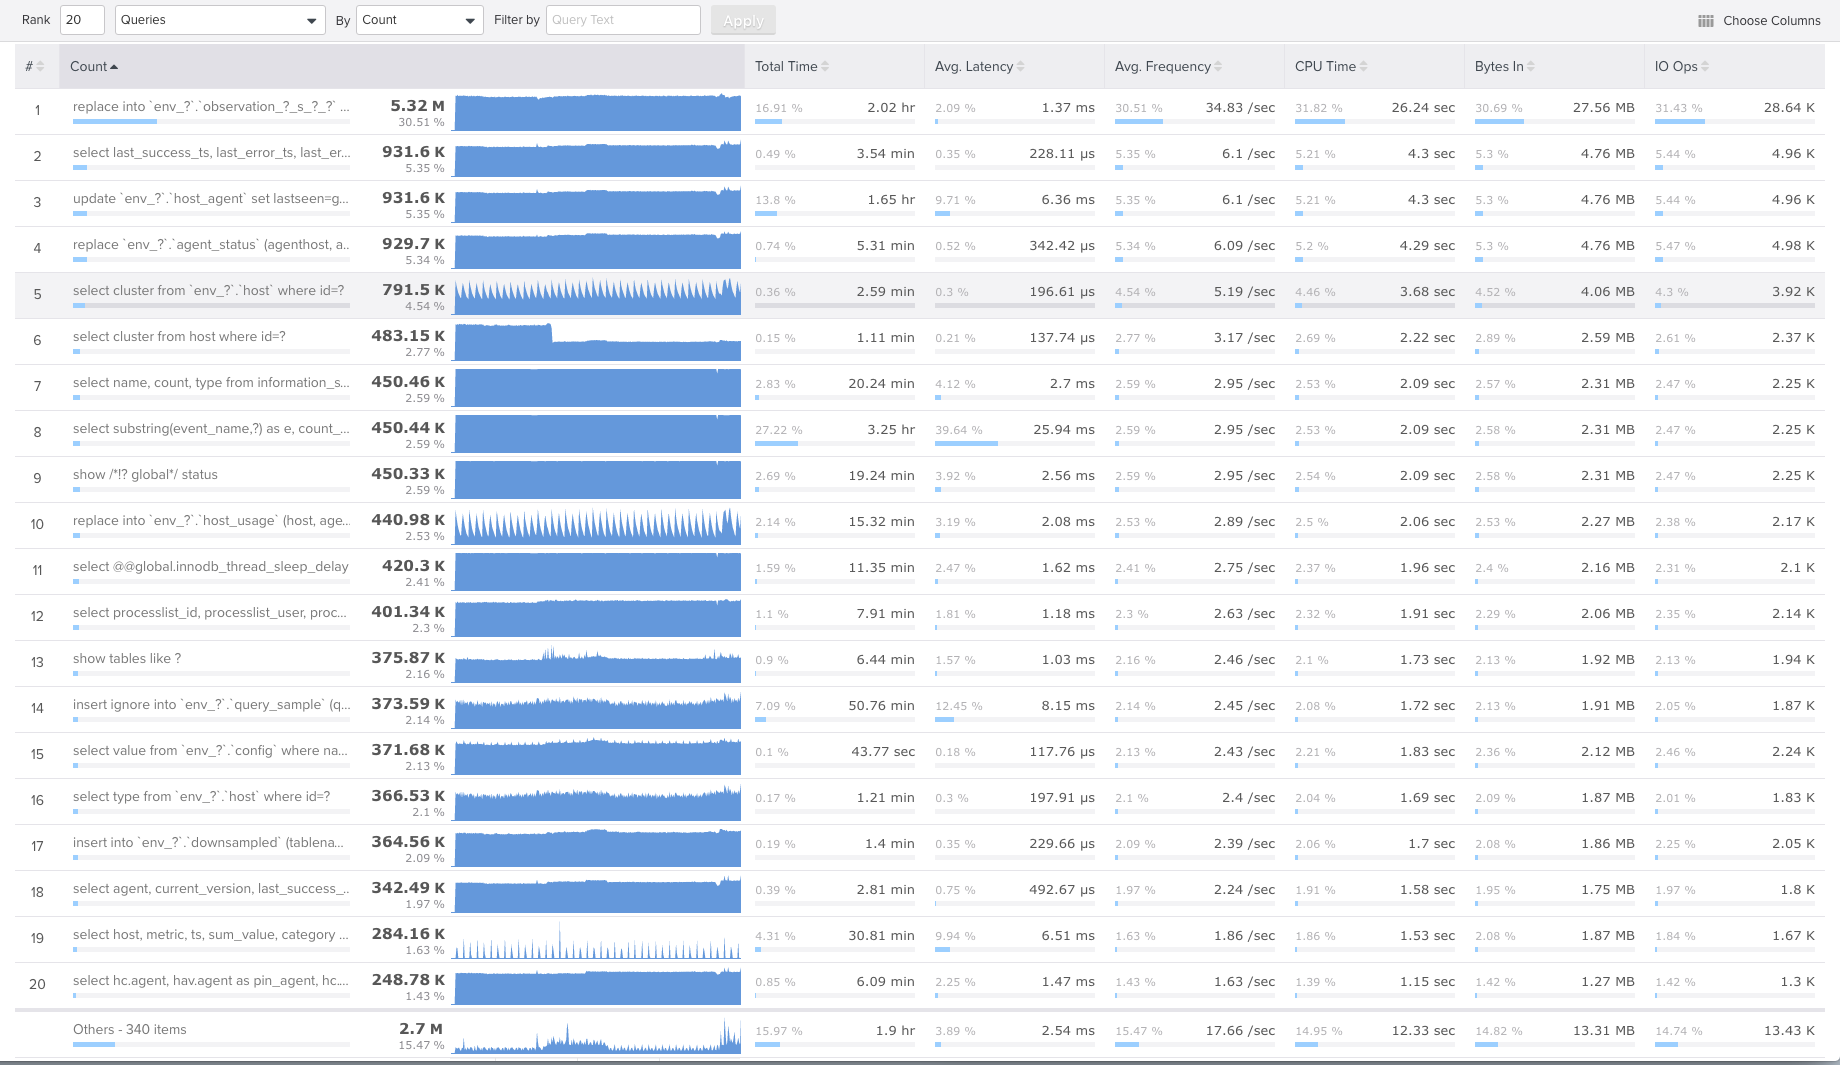
If you look closely at the table, you can easily count up to 5 individual pieces of information on each cell. If we had, say, an average of two Angular bindings per component, then the number of $watchers per row could easily reach half a hundred. And that, multiplied by the number of rows, means ... a whole lot of them.
Now, this isn't necessarily slow. Maybe the browser can execute a
$rootScope.$apply in less than 100 milliseconds. The problem occurs when you need your UI to be responsive to user interactions. Whether you're hovering on the charts, using the host filter, or doing any other apparently unrelated action, Angular will still compute every other $watch at least once during the
$digest of the
$rootScope. That means you won't see any updates on the screen for at least 100ms, which leaves you far short of the desired minimum 30fps.
So, this can easily go wrong. You type one character in an input, its
ng-model catches the change, and you end up executing a full
$rootScope.$apply. If you have thousands of bindings in the page, then you're following the perfect recipe for creating UI lag.
It would be great if there were a way to tell Angular interacting with one component doesn't require it to refresh all others. Some parts of our app are completely independent, so a full refresh isn't really needed. In this case, typing in the host's filter input only affects a few local scopes around the filter component.
Although this isn't supported by AngularJS natively, it's easy to do so by replacing the implementation of the native Angular directives. There's plenty of information about how to do this -- in
this blog post, for example.
This strategy is sort of a hack though, so we first tried other solutions that don't require overriding angular directives.
Timers can also affect your code in the same way. Let's say that for some reason you add an
$interval to your app to perform some really cheap computations once per second. It would look something like this:
var sum = 0 $interval(function() { sum += 1000; }, 1000);
The code appears harmless. But looking at the Timeline tab in Dev Tools, you'll see something like this:

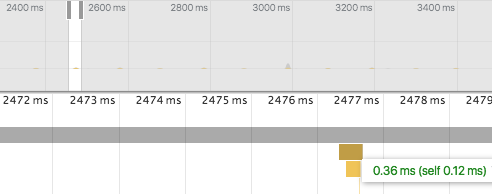
Pretty obvious... but if you zoom in and look closer, each one of those peaks becomes something more like this:

Now, that looks pretty bad. Again, Angular needs to execute the whole
$rootScope.$digest each time the timer fires up to see if anything needs to be updated in the UI. If, like us, you have no need for this timer to execute inside Angular, then you can use the old
window.setTimeout and
window.setInterval and save some trees. The result is the timer instead takes about 30 ms to execute.
If you do a web search for "Angular performance," you'll find many more performance killers and ideas to apply.
These slides present many of them, as does
this blog post.
Diagnosing
I wanted to address how to find out:
- Where exactly is the performance problem located?
- How many $watchers is our app executing per $digest?
- Which of them are the most expensive?
- Which of them could be removed?
We found the following tools to be exactly what we needed to answer these questions.
Code Snippets
This is a
repository of useful code snippets you can keep at hand, using the
Chrome snippets feature.
Of particular interest,
many of these snippets are specific to AngularJS performance tasks.
Say you just refactored your code to eliminate some
$watchers and/or
bindings; now you want to know the total impact refactoring caused on the count of
$watchers executing in your app.
ng-count-watchers to the rescue.
Playing with this script could prove to be really surprising. The number of watchers can be drastically changed by the most innocent pieces of code.

AngularJS Inspector
The
Angular JS Inspector is a fantastic Chrome Dev Tools plugin, based on
Batarang, but greatly improved.
The Performance tab comes in handy here, because it displays all the running
$watchers and sorts them by accumulated running time. Using this, you can find out which are the watchers executing in your page, and which of them are the most expensive.
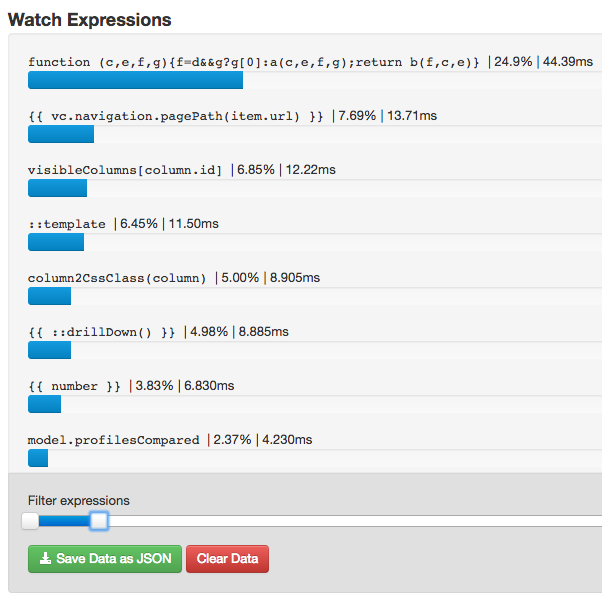
Additionally, it allows you to slice the ones you want to see with a convenient slider at the bottom. So you can, for instance, focus your efforts on the top 20% of them.
By using this tool, we were able to quickly identify and remove unneeded $watchers; cache results for the expressions that don't change; replace expensive expressions with more cheaper ones; plus all sorts of other improvements.
Our results were immediate gains in performance -- the CPU usage reported by the Chrome Task Manager went down from 60% to 0.5% in some cases.
Chrome Timeline Tool
But this isn't enough. After doing all this, chances are you'll still have
$watchers in your code that you can't possibly remove without altering the functionality of your page. To go deeper and optimize those, we need to know what specific code Angular is executing on each
$digest, and how much time it takes. The Timeline tool can help out here.
If you don't know what the Timeline is, then please do yourself a huge favor and go give it a try now: open your Angular app in Chrome, open Dev tools, go to the Timeline tab, and hit the record button. Interact with your app a bit... and
boom. If you're unlucky, you'll see something like this:
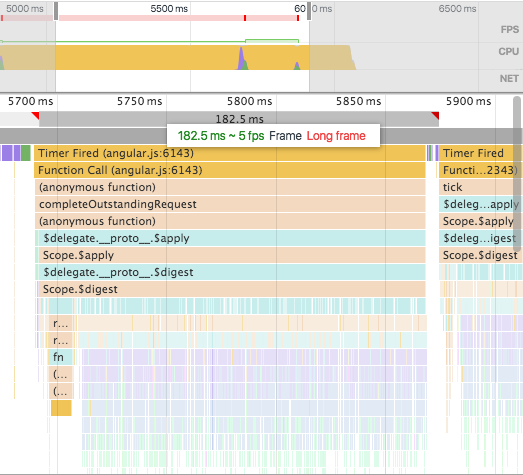
There are all sort of performance problems shown right there. For example,
note the red triangle in the upper-right corner of the rectangle surrounding the timestamp "182.5 ms." This triangle indicates the browser has failed to keep up with rendering the page at the desired frame rate, because your JavaScript code was executing. So if you see a lot of these warnings, then there's a good chance you can improve the perceived performance of your app.
While interacting with your app, sometimes you trigger reflows or repaints. This means the browser has to render portions of the screen. It's desirable to do this at a frame rate between 30 and 60 per second. If you cross the 60fps barrier, you'll notice lag or flickering.
The Timeline tab shows the individual frames rendered and the time they took, so you can see exactly what's slow and where you should look to optimize.
Conclusion
Don't wait any longer to learn how to optimize your Angular app. Give a try to these tools and see what you find out. I can assure you, it'll be fun.

 As you can probably guess, this behavior relies heavily on the power of Angular, which is constantly watching the given timestamp and updating all displayed values when it changes.
Timing these features using the performance api, we found none of them had clear performance issues themselves. We could see the hosts filtering and the metrics hovering working fine in most situations. But in some cases, both would start showing lag.
The Profiler tool shows a lot of information on the screen. You can rank up to 50 queries and toggle ON for more than 20 columns, each of which contains one bar chart and two numbers.
 If you look closely at the table, you can easily count up to 5 individual pieces of information on each cell. If we had, say, an average of two Angular bindings per component, then the number of $watchers per row could easily reach half a hundred. And that, multiplied by the number of rows, means ... a whole lot of them.
Now, this isn't necessarily slow. Maybe the browser can execute a $rootScope.$apply in less than 100 milliseconds. The problem occurs when you need your UI to be responsive to user interactions. Whether you're hovering on the charts, using the host filter, or doing any other apparently unrelated action, Angular will still compute every other $watch at least once during the $digest of the $rootScope. That means you won't see any updates on the screen for at least 100ms, which leaves you far short of the desired minimum 30fps.
So, this can easily go wrong. You type one character in an input, its ng-model catches the change, and you end up executing a full $rootScope.$apply. If you have thousands of bindings in the page, then you're following the perfect recipe for creating UI lag.
It would be great if there were a way to tell Angular interacting with one component doesn't require it to refresh all others. Some parts of our app are completely independent, so a full refresh isn't really needed. In this case, typing in the host's filter input only affects a few local scopes around the filter component.
Although this isn't supported by AngularJS natively, it's easy to do so by replacing the implementation of the native Angular directives. There's plenty of information about how to do this -- in this blog post, for example.
This strategy is sort of a hack though, so we first tried other solutions that don't require overriding angular directives.
Timers can also affect your code in the same way. Let's say that for some reason you add an $interval to your app to perform some really cheap computations once per second. It would look something like this:
 Pretty obvious... but if you zoom in and look closer, each one of those peaks becomes something more like this:
 Now, that looks pretty bad. Again, Angular needs to execute the whole $rootScope.$digest each time the timer fires up to see if anything needs to be updated in the UI. If, like us, you have no need for this timer to execute inside Angular, then you can use the old window.setTimeout and window.setInterval and save some trees. The result is the timer instead takes about 30 ms to execute.
 If you do a web search for "Angular performance," you'll find many more performance killers and ideas to apply. These slides present many of them, as does this blog post.

 Additionally, it allows you to slice the ones you want to see with a convenient slider at the bottom. So you can, for instance, focus your efforts on the top 20% of them.
By using this tool, we were able to quickly identify and remove unneeded $watchers; cache results for the expressions that don't change; replace expensive expressions with more cheaper ones; plus all sorts of other improvements.
Our results were immediate gains in performance -- the CPU usage reported by the Chrome Task Manager went down from 60% to 0.5% in some cases.
 There are all sort of performance problems shown right there. For example,