Home > SolarWinds Database Performance Monitor & Grafana: Better Together

SolarWinds Database Performance Monitor & Grafana: Better Together

Many of our customers have asked us to integrate with Grafana, the popular open platform for analytics and monitoring. The wait is over: we’ve released a plugin that lets you retrieve and display SolarWinds® Database Performance Monitor (DPM) metrics in your own Grafana dashboard. With this integration, you can combine metrics and dashboards from all of your systems and tools into a single source of truth that your team is already familiar with, giving them the ability to explore and use DPM’s data without having to learn a new tool. We believe in empowering everyone to access performance data, removing barriers to understanding. It’s been our experience that when entire teams find it comfortable and familiar to inspect database and data-tier performance and behavior, adoption spreads quickly and there’s a lot more value. Special people with special knowledge gradually transfer their skills and abilities to whole teams, who are then able to ship better code and fix it faster when it fails. Grafana helps with all of this, and we’re big believers in showing up where our customers already are, so a Grafana integration makes perfect sense. Visualize Any Metric Grafana offers fast and flexible graphs with multiple ways to visualize metrics and logs. Grafana’s visualization features let your team explore and understand DPM’s metrics in context with metrics from other sources such as logs, system data, and observability data. A familiar interface and universal accessibility into performance data is an important step in building a data-driven performance and engineering culture. Grafana’s visualization features let your team explore and understand VividCortex’s metrics in context with metrics from other sources.   
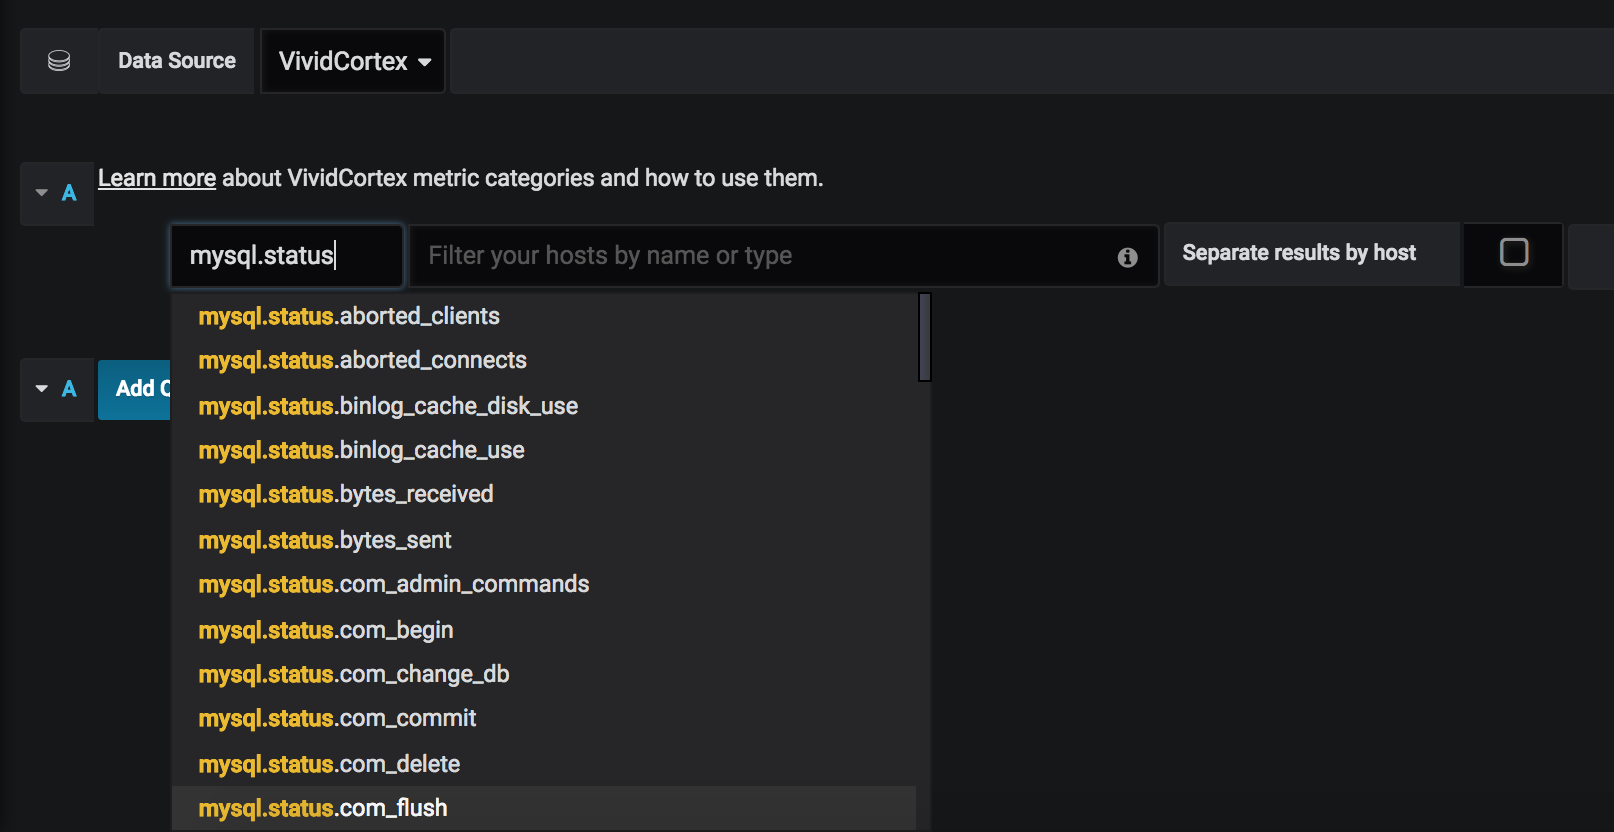
Explore Metrics Interactively with Autocomplete 
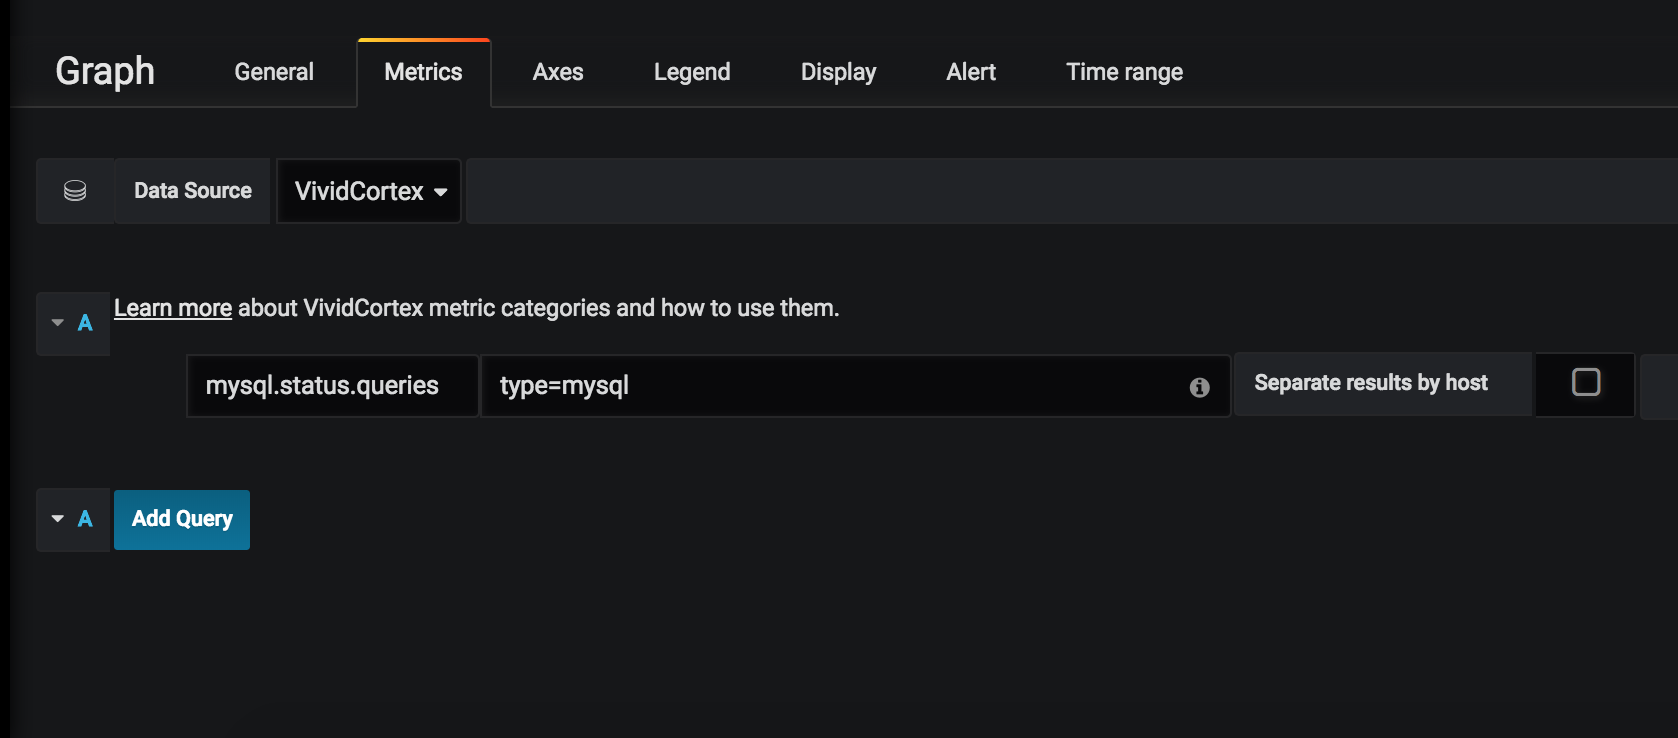
SolarWinds DPM collects a wide variety of metrics about your queries and databases. But when you have hundreds of metrics, it can be difficult to find the one that you want. To make it easier to  find the metric that will help solve your issue, the Grafana plugin auto-completes metric names, so you can browse fluidly through the hierarchy to see what the metric looks like without having to know the name in advance. For example, in the below screenshot, you can view all metrics from SHOW STATUS quickly, shortening the hypothesis-testing cycle to diagnose issues faster and more intuitively.

The Grafana plugin auto-completes metric names, so you can browse fluidly.

  Slice Your Application and Data-Tier Workload Modern applications rarely use a single database technology: polyglot persistence is much more common. SolarWinds DPM provides a unified perspective on database performance and behavior, independent of the underlying technologies. But when your application’s workload is distributed across four types of database and hundreds of nodes, how can you make sense of it all? Drilling down from the bird’s eye view to a single technology at a time is a powerful way to isolate and focus on what matters. DPM supports that, and we’ve gone the extra mile to expose it in Grafana too, using Grafana’s ad-hoc filters that allow you to create new key/value filters on the fly. Here we’re showing a simple example of key/value filtering to isolate only the “mysql” portion of the workload in Grafana. With Grafana’s ad-hoc filters you can create new key/value filters on the fly. The Grafana integration is available at no charge to all SolarWinds DPM customers. 
Avatar photo
SolarWinds
We’re Geekbuilt.® Developed by network and systems engineers who know what it takes to manage today's dynamic IT environments, SolarWinds has a deep connection to…
Read more