SolarWinds 2020.2 product releases contain upgrades, improvements, and new features across the entire stack. Solutions for IT operations management, software-defined infrastructure, and hybrid IT monitoring all have been updated.
In this episode of SolarWinds Lab, Head Geek Patrick Hubbard and a team of product experts will walk you through some of the highlights of these latest releases. They’ll focus specifically on the Orion Platform products, as well as security and database tools.
Here are some key highlights:
- New Installer (1:22)
- Improvements to Configuration Wizard (2:32)
- NCM Now Supports the Ability to Run Multiple Firmware Upgrade Jobs in Parallel (59:00)
- Web Performance Monitor Recorder Can Now Save Recordings for Playback on Pingdom (1:13:32)
- Enhancing Monitoring Capabilities Through Databases With SCM (1:33:49)
- Analyze Historical Data With SCM (1:40:40)
Watch the full video here.
New Installer
Patrick Hubbard: Why don’t we start actually with maybe the thing that it seems subtle, but for existing customers, especially ones with really complex environments is the new installer. And when I ran this thing, I mean, I got to see it for months early and play with it. But the first time I did my upgrade, I was really surprised at how smooth that experience was.
Jeff Blank: Yeah you know Patrick, that’s a great place, ’cause where do we start all these features enhancements other than how do we get there first? And first our customers really need to upgrade and have that experience. And we did a lot of work around this piece to make sure that that is a more pleasurable experience and give back customers that critical thing that none of us have enough of, which is time. So the first piece that I’d like to bring up is we’re bringing back an old friend. In the 2020.2 release that we’re talking about here, we’re bringing back support for Windows 2012 and SQL 2012 database. We still have a large portion of our customers running 2012 and this really just removes a blocker to make sure they get to take advantage of this great, great release.
Improvements to Configuration Wizard
Jeff Blank: The next thing that we did, which seems small, but like you said, you experienced it. I know you’re tinkering in your lab. Was improvements in the configuration wizard. Really that’s all about optimizing the behind-the-scenes functionality to ensure we’re expediting again, the time it takes to complete that task. I don’t wanna get too big into the technical weeds, but we did a whole lot of things to optimize that performance. One of those we call in-house configuration wizard paralyzation. That’s really about multitasking. I know you cook a lot. You talk about it, but you probably don’t start that venture by going to the grocery store, picking up one ingredient at a time, coming back to the house, going back to the grocery store. So in essence, that’s kind of what we did here. We made sure that we were taking advantage of the resources that are sitting idle when they’re not supposed to be. It’s shown massive, massive amounts of improvements. I know in one example of my lab from a previous run of 20 minutes down to five minutes. So it’s quite a drastic change.
Patrick Hubbard: Well because you’re essentially running that same code even with the new remote install capability, that code runs on your remote pollers as well. So you’re seeing not only benefits just to that initial install, but especially if you have remote pollers that is a multiplicative gain in time or reduction of time in the overall end-to-end deployment for an update.
Jeff Blank: Exactly right. Exactly right and we didn’t start there and you already made the point to bring this up. We wanted to combine those improvements, those types of things with something else. In this case, we wanna pay special attention to our customers that have those more complex environments. You just mentioned polling engines and any scalability engine, whether it’s additional web servers, HA. Those running all those different types of scalability engines and those larger distributed environments. They end up with a larger task when it’s time to upgrade and we needed to do something about that. So using the power of centralized upgrades, we introduced a new workflow and a special feature that I really wanna highlight here ’cause I think it’s pretty exciting.
Patrick Hubbard: Yeah, I think less talking just show it because it is so straightforward to you now.
NCM Now Supports the Ability to Run Multiple Firmware Upgrade Jobs in Parallel
Patrick Hubbard: There were also a couple of really cool updates for NCM especially in terms of being able to, I don’t know, deploy faster.
Joe Reves: Yes, absolutely. Let’s take a quick look at NCM. We’ll look at network configuration here and we’ll look at our firmware upgrades. So we’ve made some changes to allow you to run multiple firmware upgrade jobs in parallel. We’re not serializing those anymore and that allows you to make better use of your very precious maintenance windows and keep your environment secure and up to date with the latest set of patches.
Patrick Hubbard: Now, of course, anytime I hear about parallelization, I wanna make sure that I can control that. So you can actually do a hybrid, right? You can have some that are deployed all at the same time, but then maybe for core or something else where there is actually a set of dependencies for the order that they need to be pushed out, you can still do that as well.
Joe Reves: You can still do that. You’ll need to structure those jobs though. There’s no dependency management yet, but you can structure those to do a batch in parallel and then do an additional job then that is dependent on those.
Patrick Hubbard: Oh, that’s awesome. Okay, so that should result in faster deployments for firmware.
Web Performance Monitor Recorder Can Now Save Recordings for Playback on Pingdom
Patrick Hubbard: All right, so last step. This one is a favorite. It’s been requested a lot and that is you’ve extended the recorder that’s used for WPM, Web Performance Monitor, so that it can also save those recordings for playback on Pingdom.
James Barnes: That’s right. Many people have been telling us since we bought Pingdom, which has been many years now that they’d love to see these two products come closer together. And so we’re starting to take that path. We’re going down that path, and this is step one basically go into the recorder, create your recording, create your transaction. And when you’re done, you have now a fork in the road that you can take. You can still save it to Orion, of course, but now you could also save it to Pingdom and run that transaction directly from Pingdom.So you can take advantage of the Pingdom infrastructure to run those or you can save it to your traditional Orion infrastructure.
Patrick Hubbard: You have a screen we could look at?
James Barnes: I absolutely do. So here, you can see the recorder interface kinda glance to the upper right. You’re gonna see there that now truly enough, there is a option to save to Pingdom and here I’m saving my recording to Pingdom and here it is listed in an inventory of transactions running on Pingdom itself.
Patrick Hubbard: So that’s the Pingdom interface, not the Orion interface.
James Barnes: That’s right. That’s the big thing here is, this is your we’ve drilled all the way into the detail now and this is our transaction that we recorded in the recorder running directly on Pingdom.
Enhancing Monitoring Capabilities Through Databases With SCM
Ashley Adams: My name is Ashley Adams. I’m in Austin, Texas, and a product marketing manager. Today with me, I have Manja. She’s in our Berlin office, and she’s going to cover along with me some of the latest greatest features from SCM, ARM, and SEM. These are gonna help you to better manage, detect any potential threats, and up-level your security posture. So with that, I will give it over to Manja.
Manja Kuchel: So, hey, everybody from Berlin, and actually today’s a great day talking about all the news and let’s get started with Server Configuration Monitor and with SCM, as we like to call it internally, we enhance the capabilities to monitor through databases for changes to table and index structures, for users, permissions, and resource configurations for SQL Server, Postgres, and mySQL Server. So let me take you into the demo for a second. Looking at the demo right now, you see a list of your server configuration nodes. So you see all your servers, and then you can drill down into the number of profiles you have assigned to them. You also see a baseline number of mismatches, and of course, we allow you to drill down into a detailed configuration page. And by going there, you can choose a profile with a baseline mismatch. So right now, from here, you can click into one of those and what you’re gonna see is a before and an after situation. So we allow you to see your situation before you had any configurations happening, and then your after situation, and obviously there’s a mismatch and this is gonna help you to mitigate any things happening in your servers, set up changes. So from here, you can take over and just edit your changes, save that, and go back to a more configured situation.
So with that, taking it over to ARM, which as I said before, is focusing on hybrid IT as the number one feature. And there has been some more tiny teeny features that we added, but overall, we increased the number of resources you can now monitor and manage. And with that, we increased the security capabilities for Microsoft Teams to manage and secure access. We also gave you the ability for Azure monitoring to do like a more in-depth monitoring of what is happening in Azure AD. So with that, you’re protecting your in between, like your on-prem, but also your cloud and everything that sits in between those two worlds, you can now monitor and report on. And on top of that, we increased the interoperability with SEM and ARM. So ARM is not only taking all those events and alerts, but it’s getting more information into Security Event Manager based on user. So you will not only see just logon failures and anything happening in your system from SEM, but now you get additional information on a certain user and where they would have permissions. And also if they act against those permissions, SEM can now capture that as well. All this is done by syslog, so it’s as easy as it can be.
And with that I’m gonna take you over to the ARM demo for a second. As we look into ARM the rich tie-in and we see the most important features of ARM listed on the start page, starting with permission analysis, really the first step that everybody should be doing, like who has access to what, the user provisioning and you can do that for multiple resources and technologies. Also the security monitoring with all your alerts that you can now forward to SEM. And then the biggest part, or it seems like the biggest part is the documentation and reporting. And this is exactly where I wanna take you right now, because with all these latest features, what is great about it is that you can now report on Teams and Azure AD. And taking you into here, this is just one of the reports you can do. You can add your own titles, you can have more information added to this, and this is where you’re gonna choose your resource. And you can do that of course, for like File server, Exchange, SharePoint Online, SharePoint, but now you can also do that for Azure AD and in addition for Teams. And this is where we’re gonna take you right now.
So we drill down into Teams and this is just a demo setup. So in your environment, this is all gonna look like different. You’re gonna see all your groups and your team members, but I’m gonna go for all colleagues. And this is as easy as it gets. You just choose the certain area you wanna report on, you can then add more details, filters, group settings, or any other options. And there is a great feature hidden in this. You can not just only start this manually, but you can also set this up to be sent to you on a daily, weekly, monthly, or whenever you want kind of basis. So this is gonna send, or been sent to you as email, and once we apply this, this is gonna take a little second and we hit the start button and I’ve prepared a report for you to look at. And right now you see this is gonna come to you in a PDF kind of format. So you see, this is our ARM report, who has access where, and we are looking at all colleagues, and we are also looking at Teams and Azure AD.
So now it’s breaking down for us the all colleagues section in our Teams environment, and you’re gonna see all users that are under all colleagues. Obviously that’s gonna be all colleagues. But what’s great about it is showing you if these are just a member or if they are an owner of a certain group. And this is important because right now with everybody working from home, not being in the office, we don’t know who can add people to a team or get people out of a team. And with this, we just gain more overview and as always in ARM, you get a little explanation to everything, so even if you don’t know what all this means, this is gonna explain to you in the report in more detail, or you can do way more things with ARM in particular and you can forward everything and you can report on everything. You can have things sent to you as an email but if you wanna learn more about it, just let us know. But with this, I’m kicking back to Ashley for Security Event Manager.
Ashley Adams: Thank you so much Manja. Those are some really interesting features.
Analyze Historical Data With SCM
Ashley Adams: Today I’m now going to be showing you guys the new feature in Security Event Manager. We have a couple of different highly requested user features, but what was really big for us was the analyze historical data. So if you toggle over to the events tab, you see your events coming in real time as usual. But if you wanna take a look a little bit more in depth, you can click over to that tab and you will then start seeing events in this histogram where you can look at events during any specific periods. So if you click here, you can look at events over the last 10 minutes, 30 minutes, 30 days, or of course, be able to customize that date range to your specifics. By clicking search, let’s look at events for the last 30 minutes. A user case that people are often interested in, of course, is seeing user logon failures. So what we have, what’s great with SEM as you probably already know, is our amazing ability to have a bunch of predefined filters. So if you type in something like logons, you can look at user logons, simply add that, goes right up into your query search bar. Just wanna hit search again. And now you’re specifically looking at those events over a given period of time. What’s great about this as well, is that you can actually drag and drop to zero in, even on a more specific time base. And if you, of course, wanna look at sort of the normalized log and an event or a specific user, you can click into that event and you will have all of your event details displayed on the right-hand side of your screen.
Full Episode Transcript
Welcome to a special episode of SolarWinds Lab, where we’re gonna cover a bunch of the new features, the latest release for the SolarWinds Orion Platform. We’ve got a ton to get to and one of the greatest things here is because of the interwebs and hopefully, a little bit of upstream bandwidth, we’re gonna be able to include more product managers and more product specialists than we’ve ever had in an episode before. And so to start, please welcome Orion Platform product manager, Jeff Blank.
Hey Patrick, how’s it going?
It’s going pretty well. If you can tell I’m just a little bit excited about this. We’ve got over a dozen features to go over. So why don’t we just jump straight in and let’s talk about the new modern dashboards, because I mean, look at this, right? So it’s not just column-
Patrick, Patrick, time out, time out, time out. Bring it back a little bit. We’ve got a lot to cover, a lot of great enhancements. The platform in general has tons of stuff to cover and we have a little bit of time. Let’s go through it in a little bit of more of a progression before we jump right in.
Okay, all right. That’s fair, that’s right. And we’re gonna be talking about over a dozen new features that have been added across, not just the network monitoring and management tools, systems, databases, and security. So we are going to get into these in depth in this episode. But why don’t we start actually with maybe the thing that it seems subtle, but for existing customers, especially ones with really complex environments is the new installer. And when I ran this thing, I mean, I got to see it for months early and play with it. But the first time I did my upgrade, I was really surprised at how smooth that experience was.
Yeah you know Patrick, that’s a great place, ’cause where do we start all these features enhancements other than how do we get there first? And first our customers really need to upgrade and have that experience. And we did a lot of work around this piece to make sure that that is a more pleasurable experience and give back customers that critical thing that none of us have enough of, which is time. So the first piece that I’d like to bring up is we’re bringing back an old friend. In the 2020.2 release that we’re talking about here, we’re bringing back support for Windows 2012 and SQL 2012 database. We still have a large portion of our customers running 2012 and this really just removes a blocker to make sure they get to take advantage of this great, great release. The next thing that we did, which seems small, but like you said, you experienced it. I know you’re tinkering in your lab. Was improvements in the configuration wizard. Really that’s all about optimizing the behind-the-scenes functionality to ensure we’re expediting again, the time it takes to complete that task. I don’t wanna get too big into the technical weeds, but we did a whole lot of things to optimize that performance. One of those we call in-house configuration wizard paralyzation. That’s really about multitasking. I know you cook a lot. You talk about it, but you probably don’t start that venture by going to the grocery store, picking up one ingredient at a time, coming back to the house, going back to the grocery store. So in essence, that’s kind of what we did here. We made sure that we were taking advantage of the resources that are sitting idle when they’re not supposed to be. It’s shown massive, massive amounts of improvements. I know in one example of my lab from a previous run of 20 minutes down to five minutes. So it’s quite a drastic change.
Because you’re essentially running that same code even with the new remote install capability, that code runs on your remote pollers as well. So you’re seeing not only benefits just to that initial install, but especially if you have remote pollers that is a multiplicative gain in time or reduction of time in the overall end-to-end deployment for an update.
Exactly right. Exactly right and we didn’t start there and you already made the point to bring this up. We wanted to combine those improvements, those types of things with something else. In this case, we wanna pay special attention to our customers that have those more complex environments. You just mentioned polling engines and any scalability engine, whether it’s additional web servers, HA. Those running all those different types of scalability engines and those larger distributed environments. They end up with a larger task when it’s time to upgrade and we needed to do something about that. So using the power of centralized upgrades, we introduced a new workflow and a special feature that I really wanna highlight here ’cause I think it’s pretty exciting.
Yeah, I think less talking just show it because it is so straightforward to you now.
Yeah, couldn’t agree more. Okay, Patrick. So this is kind of where we start out here and if you’re unfamiliar with centralized upgrades, it was delivered a release back or so and really allowing customers to take advantage of this new My Orion Deployment page where you can see deployment health and some other things. But I wanted in particular to talk about kind of the new UI and workflow that we’re looking at here on the screen. In this case, the Updates & Evaluations tab is representing what I have running in my environment and what I have the option to upgrade to if I so desire. Now, many customers didn’t realize that in the past they could use this tool to kind of identify what they need to do to ready themselves for the upgrade. We didn’t have a clear decision-making tree and they really were hesitant to start an upgrade. No joke, I did that a few times myself, so I can understand why they ran into that piece.
Well, it’s also nice because you know what you have. So a lot of times you’ll see us talking about new features and you’re like, well, what version do I have? Or maybe even if there’s a module that’s gotten kind of out of phase, you can come to this page and you’ll know exactly what you’re currently running.
Yeah, that’s a great point and you can see that here in this example. And what I have, and what I wanna focus on is kind of the three options down here at the bottom. We have make a plan pre-stage, or upgrade an eval now. If you’re a customer ready to go, you’re already full steam ahead. You have that third option. You know what that does, it walks you through the normal process and all of these follow the same type of workflow, but if I choose to make a plan, for example, what this does is bring up the next page, which gives me even more detail about what I have available, the products that I have installed in this particular lab, what they will be upgraded to. I can even choose to install additional product evaluations, learn more about products I may not be aware about. It just gives us opportunity to do that right here from a single screen.
And one of the things that I love most about this view too, is the release notes button right there is gonna take you directly to the release notes for that module, for that release. So you can go out to the Customer Success Center and it’s pretty easy to navigate, but here, there’s none of that. You literally click on the release notes tab and you can see what those features are. If there’s been like scalability improvements or maybe requirements or recommendations, that’s gonna the details of, if you were interested in the details, if you’re not just to say one, two, three install, that’s a great way to read those notes, if you want to.
100% agree and I think it’s a great point too. Once we continue and if I choose the next button down at the bottom of the screen, what we’ll automatically do– And I have a smaller environment in this example, but we’ll make sure that we can connect to each of those scalability engines. You can see, I have an HA server here. There was an additional polling engine. And if there is a problem, what it does is tell me, we were unable to connect to that for some reason. That might be something you were unaware of, something you can go troubleshoot. You can choose to exclude servers, all those types of things but it gives us the ability to make sure, one, you have access to all the things that you need access to.
Well, it’s great because if you maybe have a lab poller or something else that maybe you’ve sort of forgotten about that normally you’d go through your upgrade process and upgrade my install right there. You can make sure that that’s not gonna happen because your connectivity to all of those is available before you ever start.
Exactly right. The next page here is of course the system checks. Many customers might be familiar with this. This is really our health checks. Making sure things are okay on that polling engine. Do you have enough disk space? Is there some sort of other update that you need to be aware of? We do have indications that tell you, hey, something to check out before you proceed and of course, do database backups and all those types of things. So this is a handy page to make sure you do take the time to read through. This will make sure your upgrade goes smoothly.
Yeah, one of the things that was a surprise to me was I saw a whole bunch of updates are required. And then we’re talking about Windows updates for required. And on the one hand I was thinking, I just don’t wanna have to go do those. I don’t wanna do this platform updates. But on the other hand, we don’t live in a world anymore where uptime for years is a good thing. And so it is a reminder that there are a lot of times, just OS platform updates, or maybe there’s some other software running on that server and that workstation that really ought to get upgraded. So yeah, sometimes you’re like, okay, I am gonna go have to go and bounce that machine, but I probably should have done it anyway for security fixes or something else. So it’ll tell you that ahead of time, so that if you have like pending updates or restart required that were already sitting on that machine, I mean, we’re not gonna require a restart, but they’re already sitting in that machine. You can take care of that first. So again, that’s gonna prevent something where there’s an OS level blocker to the Orion upgrade.
Yeah, exactly right. Exactly right. And this is really where I have, you can see there at the bottom options. We chose that make a plan to start with, and now I have the ability to do a number of things. I can print this out, for those of us that have strict change controls. If I need documentation or something like that, I have the ability to actually print this out and go run and take care of all these tasks. I have 30 polling engines with low disk space or something like that. I can go take care of all those tasks, come back and run these checks again and be fine to go. Or I have the option to proceed with what we really wanna talk about that start downloading files. This is the option to pre-stage your environment, and what this is about is many customers during their upgrades, they have to schedule, we won’t lie about it, maybe days, maybe weekends, maybe a little bit longer to accomplish these upgrades in these very complex environments. You’ve heard that before, haven’t you?
If you’ve got 30 or more remote pollers, there’s just download time to get the bits onto those machines.
Yeah, exactly right. And customers in the past, what they used to do is take the installers and move them to the servers and kind of do all that work themselves, but that still takes time. And why not take that out of the customer’s hand and make it easy for them and basically we’re gonna do it automatically through the web console and through centralized database.
That’s a great point because this is something that you all had worked on in the last couple of releases and there’s a great thread, a couple of them out on THWACK that actually explained how to do that deployment manually. And the feedback from customers was this is fantastic. This has cut a third or more out of the overall end-to-end deployment after clicking update. So essentially what you did here was took that best practice and automated it for everyone. So that’s, again, one of those things that it’s a process that came out of THWACK and working with the PM team, and now it’s literally just under that button.
Exactly right, exactly right. So when we click that button, the same process ensues but what you’ll see here is a, it’s gone through, we’re pre-staging files and this can be done again before that maintenance window, before you schedule that downtime, just to get the bits where they need to go. So you can see in this case, I excluded a particular server and you have the option to do that and come back later and update that. But it’s gonna run through, do its downloading, tell you the progress. It’s always gonna start with the main polling engine and then what it’ll do is sequentially run in groups of five, all the rest of your scalability engines and get those bits where they need to go.
And once again, those downloads are coming from the main Orion server itself. It’s not going back out on the internet every time, so you can make sure the bits are the right version.
And once that’s complete, it’s pretty easy. You see download complete, you can move on with your day, go back, come back a week later, a month later, whatever you prefer, and the beauty here is, there is some intelligence built in as well. If you come back like say, a month from now, and all of a sudden we’ve released something new, the next release is available and next updates, it will tell you and say, hey, you have the option to either proceed with your upgrade or go through the process again and get the right bits. And we’ll even make sure, hey, we take the bits that existed and we just go grab the bits that we don’t have ipso facto, and then allow you to perform the upgrade. Now, this real quick, I just wanted to highlight a couple of screenshots because we do have those advanced users out there and many times they are those customers that are using these more complex environments and we do have the ability to script this through the Orion SDK. Yeah, I know. You’re getting excited, exactly. So that is available for you. You can walk through the same steps, the process. You can even specify whether or not you wanna do the upgrades of your current running environment. You can specify, hey, you would just wanna install evaluations, specify the script argument. It’s all documented and out there.
And so, you’re showing this over here on the right-hand side. That’s SWQL studio. So again, that’s showing you what’s gonna be executed or creating an example scripts that you can cut and paste into the platform of your choice.
Exactly right.
Okay, I’m not saying I could get lost in APIs all day, but let’s go back and talk about the new modern dashboards, because this is something that has saved me a bunch of time, creating new dashboards. I think the point is one, you get new advanced widgets that weren’t available before. But two, I like to really do differentiated dashboards for different groups, especially like build something for a manager, for example, and like get them to spend their time looking at that instead of looking at the big dashboard. So I get a lot more reuse in addition to functionality I didn’t get before.
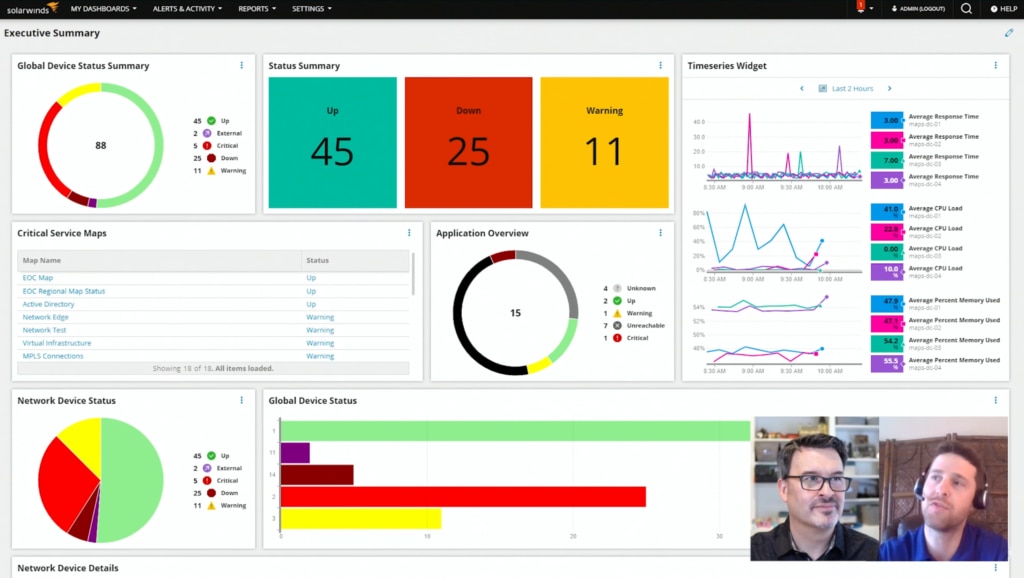
I know Patrick, you’ve been patiently waiting and it’s here so we can talk about it, What you see up on the screen is a great view of that. It’s just an example. My colleague, Tony Johnson is another platform PM and him and the Dev team have done this first version of what we refer to as modern dashboards. These data-driven dashboards were developed to provide that even greater level of flexibility. Of course, there’s a lot of widgets that people have always wanted in there. One of my favorites is the donut charts so don’t even get me started, but this was built with performance in mind using a grid-based layout system so we can have that vertical and horizontal scaling, however we want and this is really, it is a lot of fun to play with, right.
Even before you do that, this is updating in real time. These widgets are updating in real time and we call these widgets now, not resources.
Yes, correct. We really do refer to them as widgets and what you’re seeing here is an example lab, but what you don’t even realize is this is actually an EOC too. So this is actually working in the enterprise operations console and my example, here, Tony had a couple other labs I could choose from, but in general, I know you guys plan to maybe have a bigger Lab episode just on this topic at a later date, but we did wanna chat about it because it’s really important. It’s got a lot of comments and great feedback on THWACK already. Again, you have complete control to edit the dashboard. I can drag more widgets, I can change that size out if I can grab a corner here. I could change that size of that widget, adjust how things are laid out. It’s pretty neat. If I wanted to edit the widget, we have all sorts of ways to choose whether that’s a chart option like a pie or we want the legend below, or we wanna customize the data model and this is, a little bit more advanced. There’s a graphical query builder, hand edit SQL option. There’s lots of ways in which you can format this stuff. It’s super, super flexible and really responsive. You can see examples where I even did things like simple table widgets. The KPI or what people refer to as the big number of widget. These are always helpful, exactly like you were talking about, executives love to see this stuff. Give me big, just clear, concise data information on a screen, let me know what’s going on. These are always super helpful. Of course, our time series widgets, even vertical and horizontal options to scroll whether we want bar charts and different tables and it’s pretty great to be able to see this and where we’re heading with the new modern UI.
Well, and scroll back down there to the bottom because these are available in NOC views as well. So if you wanted, for example, the good old network device detail view that we’ve all relied on for years, it is available too. So if you want to combine traditional resources or in this case, I would use a dynamic group that would then be a filter on that list. So if I had a particular set of resources that I wanted to make sure were present in my top of my NOC view, along with these summary views or the big number widgets, it really lets you customize that in a way that really, I don’t think it was possible before.
Agreed 100%. It’s really cool. I can’t wait to see what happens next. If anybody’s interested and want to get involved in the conversation, make sure to reach out to us via THWACK and stuff. Tony’s got a great post out there where he walks through some examples in detail and I’m sure you guys are gonna talk about this more at a later time.
Yeah, that is one thing about this release and definitely both check out the release notes, look at the Customer Success Center, but there’s also the THWACK post that we’ll link here that actually have those step by step with screenshots and a lot of them are animated gifs, so that you can kind of see how they work visually. Definitely go check those out. I mean, if we did, we’re gonna be doing drill downs into this for eons probably on Lab, but yeah, definitely check those out because the level of detail there and follow along examples are great. So next we got to talk about maps. We keep talking about maps, maps 2.0, and it’s so funny because our new or Orion maps, but they have grown so much over the last couple of releases and this one really does feel different. Like some of the things that you’ve been able to do with iconography and color and background and the rest of it really let you customize these in a way that I don’t even think the old maps would have let you do. So let’s talk about that.
Yeah, let’s do it. This is definitely a little bit of as you would say, a passion project of mine and there’s been a lot going on here and I know we even teased a little bit at times. I might be able to show you how to travel back in time here in just a second. I have tons to cover here and I really wanna take the time to go through it.
Yeah, so you’re starting here on a view. This is the map editor. And if you upgraded to the latest previous release, which would have been 2019.4, you’d see a view that looks like this. So what you’re gonna do is walk us through how it’s changed and so the new capabilities built on top of this.
Right, I think the best way, I was gonna make a joke and say, I had this PowerPoint presentation, but I know you would come with pitchforks and everything like that. This is really all about being visual. The Orion maps project is about taking the wealth of data in Orion, those relationships and all those metrics and stats, giving it structure. Data is just boring by itself. Giving it context, turning it into more actionable information. So this is exactly where we’re gonna begin. This is what you might see if you, like you said, were 2019.4 and you could accomplish this. Now, it looks a little bit different and I’ll go through some of those nuances here. And one of the things that I noticed right away is there’s a connection that I expect to see, and I wanna do that. This was available in the last release and I think you and I both talked about how much we liked this feature. So I’m gonna walk through how to make a manual connection when automatic topology just didn’t happen to do it.
Or there is no way that topology could have done that, especially for a composite application where you’re the only one who knows how those packets are traveling.
Exactly, and that’s a perfect example because I’m technically not even monitoring any interfaces on this particular node. But what I’m gonna do is I’m gonna build a topology connection because this is how my infrastructure set up and what you’ll see here in the new map editor in the 2020.2 release is a little bit different view of the toolbar. There were a couple control actions before that kind of popped in, popped out. We made sure they were visible, so you knew they were available to you. And of course, based on selections things activate. So I’m gonna click connect objects here and over here on my switch, I know exactly what port I wanna connect to. I’m gonna connect actually on this Fa0/11 here, apply and then over on the Hyper-V server, when I click configure here, you’ll see that it actually pulls up and tells me I don’t have any information. It’s because I’m not monitoring any interfaces. Now I could go correct that, monitor the interface if I want, but what I’m gonna do is kind of trick it and this might be important for those users when they have devices that they only have an interface on one side. Out to the cloud or something like that, Patrick so I can kind of trick this. So I’m gonna choose the same device on the other side and the interface there and I’m gonna click apply. Now, the little toggle here allows me to say show ingress and that’s really so this topology connection that you can see examples of in the background, don’t show the same metrics visibly on the screen and what I’m trying to get after. Now, I’m also not gonna do this for this particular use case, but I wanted to bring up these two bullets ’cause this is very important. For this map only obviously exactly, as it seems. It’s for this map only. This second piece is something that you and I get really excited about. For all Orion. And what that means is when I create that connection and go ahead, Patrick.
I was gonna say, I have found this to be really useful because I ended up building a lot of maps for other folks. And so if it’s something where I want to establish that connection, it is always in this case, maybe between those two physical interfaces, it is always gonna be the same. And then any other map or a PerfStack view or an AppStack view or something else that could actually inherit that connection, everybody’s gonna see that. But if it’s something where it’s an application that’s different, maybe it’s an application focus map, or it’s a network focus map or there’s VPN traffic or out to cloud where the logical topology of that map is different in terms of the services that that map represents, that lets you have both the sort of default connection plus specific connections by map by map.
Exactly, exactly and you’re right. When I choose this for all of Orion, it shows up in the NPM topology widget, right along the rest of the topology connections that were discovered too. So, it makes sense for a user in that way, like you said, if I go build another map or somebody’s looking in the contextual maps that are in the static sub views on a node details page, that connection shows up. So it’s a real cool way to allow you to use a design tool and a mapping tool to define topology in the product. So we’ll click create here and then we’ll move on to some of the other things. So Patrick, yeah what we have here on the right-hand side are what we refer to as the property panels. Now, the map has a property panel itself. Every entity on the canvas will have a property panel and these allow us to do those custom enhancements that we want. It’s about making this map make sense for my organization and my team and what makes the most sense for us. I have the option to do backgrounds now, and this is really so if I choose a background image or I can choose a background color, the background image in this case, if I chose that would pop up on the back and it wouldn’t be selectable when I do like my lasso or something like that, so it doesn’t drag it all over the screen and those types of things for those users that we’re aware of, that we can insert images as well. So there’s a difference there and it just makes it a little bit more simple. In this case, I’m just gonna choose a color. I’m a little partial to blue. I always end up doing that. That’s what we’re going with Patrick, so hopefully that works for you. So the next thing here, this is, again, we have the toolbar here and I wanna highlight certain things, like there’s unique features, undo, redo. That’s nowhere else in Orion and that’s really more in a drawing tool and those are the things that we’re trying to blend here, that Visio-esque type drawing with the monitoring solution so you do not have to leave this tool. There’s ability to select all from entities to shapes. We can insert shapes. You actually have options to do alignment. So if we add shapes and those types of things, this is that bring forward, front to back type control again to where it’s just easy, simple to construct and customize this map. First, let’s start with just scaling. So if you could see here, I kind of have these named fairly decently, DC. So this is obviously, some of my domain controllers doing ADM connections from application dependency connection.
The importance of these objects is not the same. They are not equal and it is not flat.
100%, 100%. So I want these to stand out a little bit more and of course I have the infrastructure that is impacted or could impact these in their performance as well as that network infrastructure and you could see the map updating on certain things going on in the environment, but I’m actually gonna select these guys here and I just want to take a look at what I have to do in the properties panel and we’ll start with size and position. So you could see lots of different options here and I’m actually gonna make these quite a bit bigger so I can type in, we can get pixel perfect. It enlarges those items, there’s a couple other things that I wanna make a little bit bigger. Again, everything can be done in bulk, so you can see when I select one object, it tells me what that is. If I hold the control keys, like you’re used to in Visio or whatnot, I can make these items bigger. I also have the lasso object here where I can select these guys. And then of course it shows me three objects and I’m gonna make these just slightly bigger too. Again, if we’re dealing with images or I’m inserting shapes and squares, which may we may get to in this example. I have options to toggle the aspect ratios so I can change those shapes. You can even find out exactly what the X and Y coordinate is because there’s been times where I feel like it’s lined up. If something seems quite off, I can get it pixel perfect, right Patrick?
Yeah and I just love that because you can use size as a visual indication of relative importance or how much time you should spend observing that. ‘Cause in this case, there is a little bit of with this packet loss on that bottom transit link. And if that icon is large, then maybe I ought to start there first troubleshooting. If I’m going into a warning state in and out, but I’m not seeing other application issues, well, maybe we’ll get to that later. But like that idea of being able to come for someone on the team who maybe has never seen a map before, spent time on it, they get an incident report, they’re trying to do troubleshooting. The first thing when you come to a map is being able to visually represent where to start troubleshooting saves a ton of time.
Yeah, exactly right. If this were it, maybe it’d be a little bit cooler, but we’re not gonna stop there. There’s something that’s really bugging me and customers because we listened. There was a lot of things that customers really wanted and we really got a lot of that in this release. And one of those things is text. I have some of these labels and places and things where I don’t really want them. It kind of obscures, like you were saying, the view of the map and some of these items. So what’s unique is I can select a number of objects, I can select this text property piece. Now, the first thing that I wanna start with is this actual position and this is the text anchoring. So here in this case, I might wanna say, hey, move everything up top center. If I see this guy here, it’s kind of combined with a ton of things. I’m gonna say, let’s go top left. For these guys, let’s go middle right. Some of our other guys were okay. These guys are just slightly off, so I can even just use a little bit of an alignment piece, a little trick and kind of move that out. And if I stopped there, look how much better the map looks just from that piece. It’s kind of drastic. I can do a select all here. Of course I can use select all entities. So it will select everything, go back to text, and one thing that I wanna change against that blue background, I’m gonna change this to white. And now look at how we’re starting to change these, and of course I can make it bold, I can change the font size. I can change the little fonts and no, Patrick, I’m not gonna do Comic Sans for you or anything like that.
I love just for irony that you did include Comic Sans.
Exactly. We’ve got to have a little bit of fun around here. Another important piece too, is that in old Network Atlas. We’re not gonna lie here, that the eventual goal here is to deprecate Network Atlas. That announcement was made. It does not mean that Network Atlas is going away tomorrow in the next release, but in the future, it will probably say Sayonara. In the meantime, we wanted to make sure we’re doing some of those things as customers requested that allow us to parody Network Atlas. And in that case, I’m gonna select these guys. I’m actually gonna select my network gear. These are important pieces and I’m gonna go back into text and I wanna talk about this piece. This is where we can add in whatever we want. I can type in values and those types of things, but I can also click plus. And when I select multiple objects, this will be an intersection of all those objects and those entity types and all the properties associated to them. So I’m gonna choose, you know what, I don’t want an IP address. Let’s go machine type and I’m gonna add that in, insert the selected and make sure that it gets put where I wanted it. And now all those have a machine type. We’ve got to keep in mind that some of these maps might be in places where users are not going to be interacting with them. On a NOC dashboard, like you mentioned before and I might need more information. Now if the value is blank, it just doesn’t present it. So you also don’t have to worry about laying out for blank spaces. It’ll take care of that for you.
Exactly. Another cool piece with this is I’m gonna go back in here and I’m actually gonna grab this first thing. You could see, there are some metrics in here. A little pro tip, little behind the scenes thing. If I hold shift, when I click insert selected properties, what this does is actually add a prefix and a suffix based on the units and things that I added. So now I have my average response time, three milliseconds, completely showing for each of these devices. And I’ve got a really cool map so far for that piece. To our next topic, this is one of those things that everybody loves, ’cause the first question when 2019.4 came out was can I do custom icons? Have you heard that before?
Just a couple of times. That was slightly upvoted in THWACK.
Yeah, maybe just a little bit. I have tons of flexibility and options here and let’s just take this group of domain controllers first. I’m gonna expand this and you can see it’s got a default icon. I can actually click down and we provide some for you. Maybe by chance I like this icon better. Now, you have options. What you have is ability to do shapes. So if I wanted a rectangle around this object or even a hexagon, that’s what I’m using for status is the status rings. I can change color of those. I can use a status badge if I’d like. And one, I wanna make these a little bit bigger, but let’s go ahead and do that for all my entities again. So I’m gonna select that, go back into icon and say, hey, take up more of that space there. And we’ll say 65 might be a good number. So again, it kind of takes up the available space and gives me a little bit better picture, kind of brings that in. Again, lots of flexibility. As I mentioned, if you wanted to browse and use your own icon, you can see, I’ve actually done some here that’ll let me do things with those service maps. And you see something here I wanna bring up real quick. There is some really cool ways in which we could say, hey, you know what, if I wanted to have a different type of map. Maybe these icons aren’t really what I’m after. Maybe what I wanna do is have a different icon based on different statuses. So I could flip to this status piece. I can remove the need for a status ring ’cause I’m gonna be in your face. I’m gonna turn off the status badge here. And what I can do is actually for each individual status, Patrick, I can customize what that might be and in this case, I’m gonna choose I think thumbs up. Kind of neat for warning. I’m gonna do a little warning case here. For critical, I might flip this to our down and create kind of a unique paradigm where, hey, this map, maybe they don’t need the iconography so much, but you can certainly see this from a NOC screen 10 feet back, 20 feet back and it just makes, again, the possibility is endless.
Well, I’ve made the joke before about creating views for your management, but this is really a great way to do that because they just wanna know that the environment is stable. They’re looking for overall status. I mean, you care about the detail when you’re troubleshooting, but it makes it really easy to provide dashboards, to give them the confidence that you’re doing great and that the environment and infrastructure are healthy and it just makes it quick to read, quick to glance at, and then they don’t have to feel like they got to really get into the details. They have what they need, and then it can go on with the rest of their day.
Exactly and to your point, I mean, look at what we’re looking at here. I don’t have to page jump. I don’t have to go to a different module to look at things. We’ve incorporated things from NPM, from SAM, from VMAN, from SRM, all in one place and easy to look at. And again, don’t forget people that you can nest maps inside of each other. So you can have that simple executive roll up that’s just those, again, thumbs up, thumbs down or whatever, if I wanted to be a skull and crossbones or something that really stick out, I could do anything.
We’ve seen some pretty creative maps already from our customers and especially during the beta period. And that was a point I did wanna make too. And we talked about it in THWACKcamp last year. But the big difference sort of in terms of overall platform performance improvements between these maps and the old maps. So the old maps had to go do that roll up, that status roll up in real time. In this case, the Orion Platform is constantly recalculating that, especially with the cleanup of statuses and simplification and some of the dynamics that you have over roll-up status. So that’s all happening in the background in real time and so that way, if you wanna do deeply nested maps of maps, of maps, you’re not incurring additional query SQL and SWQL query time every time someone loads a page with a map. So it makes it a lot easier to just put them wherever you need them without incurring a display penalty or a processing tax penalty on the overall platform.
Yeah. Now, speaking of status, that was a great little segue into kind of the crescendo here, because we could spend all day about this. I didn’t get to show shapes and text boxes and we could insert images and like you said, I have tons of examples out on THWACK, customers are starting to share their examples, but let’s get to-
And we’re gonna show a Nutanix example of that a little bit later.
Oh, nice nice. But there’s one piece here that we haven’t talked about and that’s really this track history option. Okay, Patrick so let me see. We’ve gone back to kind of my summary page, and this is just my lab and just general examples, but let me see if I can find an example where you can specifically show off that time travel feature.
And you got the orange iconography for that map. Yeah and you see, I did the blue background again.
Sorry, I’m partial to blue.
Here’s the white version and this might work and I’ve paired it with, PerfStack. But I think I have one here where it was more similar to the map that we created. So maybe we’ll stick with this. So again, I can choose to add more widgets to this view, this dashboard, if I want to. But of course we have view mode, which toggles me into the full screen kind of interactive mode. And this is where I can really troubleshoot. If I wanna start hovering over items and all those types of things, I get status on associated metrics, it looks like the Active Directory application actually on these two servers is having a problem here. What about those cases where we’re coming in after a weekend, Patrick and somebody complained about something and you know…
It’s an email, not a ticket, but that really is it. Is that troubleshooting half the time by the time you get time to look at it, especially for non sev, severity one issues, some time has passed and you need to actually go back and look, and you could go look at the histograms, but it’s easier to look at it in context.
Right, I mean, if I had to jump through each one of these things and figure out what the impact was or what they impacted, it’s a lot easier in a map and you’re right. I mean, a lot of times everything that we’re doing as far as coming back to troubleshoot is reactive. So why not give customers a little bit of a heads up with this option to view history? So you have that option to enable that track history, and I can jump into this fully interactive mode and now I can click view history of this map. And what it does is give me a new timeline down here at the bottom. So Patrick, you were complaining about an issue that happened yesterday. Again, by default, we kind of go back seven days in history. We kind of grabbed snapshots at 10-minute intervals. I can go back to when it was clean, prior to the problem. You can even do some fun things and play this historical loop and watch as the little indicator at the bottom of the timeline there kind of flips through the different segments and shows me that from the metrics on the map, the entities on the map, their status has changed. All the different things will recalculate and show me time after time. It’s pretty, pretty sweet.
Yeah and time travel is one of those things, I think the first place that it appeared was in Virtualization Manager, where you were needed to be able to look at the topology for how VMs were organized. Then you saw it again in NetPath. So that is something that I see us continuing, I see your teams continuing to move across multiple products and I’m always a fan whenever I see it.
Exactly right. Now, what’s the next logical step here. Usually it’s we don’t have hovers because it’s not current data. So we figured out a unique solution to kind of give customers a little bit of added benefit. So you’ll see, I have 4:23 a.m. is when that problem I was asleep. This is what my administrator showed me about. I was able to use the map and go back, but what was the cause or what was the reason that I see the thing that’s down? Well, I can click on this and what it will do is automatically pull me up a PerfStack using our other tool that allows us to correlate information events. Gives me an hour before, an hour after that timestamp, allows me to click into this guy and I can see there were a lot of different problems going on with ADM and the connections between other servers and kind of start doing real-time monitoring, whatever I needed to do to isolate and identify that issue, Patrick. It’s pretty cool.
Yeah and the only tip there is when you create the map, there is that toggle to retain the time information or previous maps. Track history, and you’ll need to make sure you enable that. And the reason that it’s not on by default is maybe you don’t wanna put that in the database. So that gives you the option of how much data do you wanna collect versus do you want it for particular maps or not? And you turn it up, just flip that and it’ll start storing that data. Well, Jeff, thank you so much. This has been fantastic. The platform updates here, and we’re gonna see that now across multiple modules on Orion and some of the things that they’ve been able to do with these capabilities. But it’s always a pleasure to get to chat and thanks again for being a part of this segment.
Thank you very much. Hopefully we didn’t take up too much of your time, Patrick, and you could squeeze everything else in. We could spend all day on this, but again, people can reach out to me on THWACK. We’re very active out here. Appreciate the time and getting to show you guys this. Really had fun.
So hopefully you’re as excited as I am about some of the feature updates for the platform. Now let’s look at some of the new features that are included across the Orion modules and the security products. So to start, we’re gonna talk about network performance management and monitoring. And for that, please welcome Joe Reves. Joe, how you doing?
I’m doing all right, Patrick. Good to see you again and good to see you virtually in this time of COVID.
It’s all about upstream bandwidth. Yeah, so thanks again for being a part of this episode. What we already talked about with platform, this is an enormous episode, and of course we wanna spend a lot of time talking about the new features that have been added into some of the module releases for network performance monitoring. And you actually have, I think at one point or another managed most of the modules in Orion and right now you’re the product manager for NTA and VNQM.
That’s right, that’s right. So this release, we are extending the breadth of visibility across multiple modules, we’re delivering some key integrations that are gonna make your life easier and we’ve got a lot to cover. So we’ll be talking about features here that help extend your visibility into your hybrid environment and do some hybrid management in your Azure network surface East West traffic visibility down in your virtualized environment. We’ll be able to handle edge device configuration a little bit more gracefully than we have in the past. We’ll do some, talk about some key integrations with IPAM and IP group management, we’ll supercharge your device firmware updates, and we’ll give you some additional visibility into some of your SD-WAN edge devices.
That’s gonna be a lot to cover and this, I think will probably be about the biggest segment, because certainly we’ve got lots of customers that are using these products. What do you wanna start with?
Well, let’s get started with Azure network gateways. So Azure network gateways gives you some visibility between your network and your Azure environment, and this will monitor the VPN gateway and site-to-site bandwidth. And this actually shares some configuration and some components with SAM and VMAN. So let’s take a look at how you get there. From the home menu here, we’ll go to our cloud configuration. And what you’ll notice is there’s an additional widget here for gateway traffic by region. So in and out gateway traffic by region. The pull-out menu over here will take you to individual virtual network gateways or to site-to-site connections. If we click on the region though, we’ll go to a filtered view of our gateways. Let’s take a look at what that looks like. So these are our Azure network gateways. You can filter those if you’ve got a long list of those by the account, the gateway type. Location has already preselected here. The status or the virtual network that these guys are supporting. Selecting these individually will give you a PerfStack integration and I’ll show you what that looks like. We’ll click on one of these gateways here. That’ll allow you to take a look at bandwidth in and out over time.
And I think the thing that’s really driving that is that when you move applications to cloud and since hybrid is forever, a lot of times you find out that an application that was fine on your LAN is actually pretty expensive to pull data out of, or maybe consuming a lot of resources. So is the goal here to really be able to just pull those in alongside of all your other bandwidth metrics?
Exactly. And so when you select all of your gateways, this will go ahead and populate all of those into PerfStack. And you’ll be able to do comparisons between those two. Lab environment’s not fully populated, but you’ll be able to see how you can stack those up against each other. One other way of looking at your Azure network gateways is by the individual VPNs. And so in this pull-out menu over here, you can select the individual VPNs, and again, there’s some flexibility in terms of how you filter those by account, by encryption type, gateway and so forth. And once again, with these, you’ll be able to open these up in PerfStack and look at these on a VPN-by-VPN basis and see the tunnel traffic that is specific to this particular VPN tunnel.
And then a lot of times customers are also monitoring the VPN specifics, maybe for an ASA or another appliance where they can actually look to see what the real bandwidth is. And if there’s a linking state error or something else, they’ll drill down into that level of detail too.
So very similar presentation to what you’ve seen in some of our other VPN monitoring.
Okay, thanks Joe. I mean, we hate to admit it. We thought, well, I think some people thought hybrid was gonna be for a little while and the reality is it’s gonna be forever. And so one of those first big steps is gaining visibility into the cloud gateways, and this is really, really helpful. The second one of course is that you still have an awful lot of traffic that you’re trying to monitor on-prem, especially in between hypervisors or individual VMs. So talk to us a little bit about VDS support and VMware.
Okay. The VMware virtual distributed switch extends this kind of virtualized switching fabric across multiple hypervisors. And it gives you some insight into the conversations that are occurring between VMs that are hosted on each of these hypervisors. And so the virtual distributed switch uses the IPFIX flow format to report on these conversations. And depending on how you have it configured, those conversations will either show up as being all reported by the switch itself if you assign an IP address to the switch or they’ll show up as being reported by the hypervisor, and that’ll give you some insight into what traffic is associated with each hypervisor. Now, in both cases, the traffic is actually coming from the virtual distributed switch. So let’s take a look at what this actually looks like in NTA. So I’ll navigate over here to my NTA summary. We’re gonna take a look at the sources of flow information, and you can see right off the bat, we’ve got a bunch of hypervisors here that are listed as sources. I’ll show you another change for this release. In this release, we’ve actually separated out flow sources management to either show you a collection of interfaces or nodes. So we’ve really tried to reduce some of the clutter in this screen. Let’s take a look at nodes and we’ll do a quick filter here to pull up a handful of hypervisors. You’ll notice that these are listed as ESX servers, as sources of flow information. This is actually coming from the switch, but if we click on this, we’ll be able to see traffic that’s actually associated with the VMs on each of these hypervisors.
And so it looks just like NetFlow from any other source.
Exactly. So it’s very easy to find, very easy to navigate, and very easy to associate traffic with a particular hypervisor.
So you said something before that was interesting, which is you could choose to receive that either from the hypervisor sort of the virtual switch level or the individual application. And that’s what’s really interesting to me because I can’t tell you how many times I vMotion something and then all of a sudden I run into unexpected bandwidth or maybe a resource or where the network really wasn’t tuned for an application I didn’t know until I moved that workload. So is that really the goal there to be able to monitor east-west regardless of where that VM happens to be?
Yeah, this gives you insight into application architectures. So what part of the applications are talking to each other? So if I pick up a VM and I move it across the data center, I’ll have an understanding of what kinds of conversations I might pull across my physical switches. And likewise, if I wanna pick up that particular VM and that workload and move that to public cloud, I’ll be able to understand what kinds of conversations are associated with other workloads in that environment, and I might have to move as well.
Now this does bring us to something else which actually dovetails into a previous top ranked and voted up feature request, which is how do you keep track of multiple flows that may actually be on a single host where you’re not double reporting that data?
Right, so let’s roll into the next feature, which is node reconciliation. So in node reconciliation, we’re basically providing you a mechanism to tell NTA when your edge router device configuration could result in situations where we are double counting traffic, and then we’ll handle that more gracefully within the application. So for this, I’m going to point to a THWACK posting that goes into some level of detail about node reconciliation, and I’ll show you what this looks like. So you can find this on THWACK in the NTA forum and this goes in and provide some background on this challenge that we have with mixed configurations of edge router devices. And this has been a chronic problem, I think, based on how certain vendors permit you to configure the way that flows are exported. So to use this feature, we’ll navigate to flow sources again, and we’ll select one of our edge router devices you can see in the background here. And then we will bring up a dialog that says reconcile node. And in that dialog, we’ll be able to specify on an interface-by-interface basis, how we have configured the interfaces to export flow. So in some cases, we’ve got interfaces that may be exporting only ingress records or only egress records. Some that are exporting both ingress and egress and in situations where we have some interfaces configured to export flow in one direction and some in both directions, that can actually result in double counting the traffic as it transits through the node. So this feature allows you to reconcile NTA’s view of the actual configuration, handle that correctly, and represent the traffic correctly.
So you’re effectively giving it hints about what it should do with that data that’s being collected.
Exactly. And then you’ll be able to see accurate traffic volumes through the node, as well as to the interface.
I know that’s been requested at a long time and hopefully we get some great feedback on how that’s working. Okay, another big area comes when organization of traffic, especially where you’re trying to map sort of the business’s view of traffic to the actual underlying infrastructure. And I think we use IP groups for that, or a lot of customers are using IP groups for that, but there’s been some extensions that actually make it a lot easier to manage in one place and tie it into IPAM.
That’s right. So we’ve built a new integration with IPAM. It’s been requested for quite some time that allows us to surface IPAM-authored IP groups into NTA and use that. And so let me show you what that looks like. First, we’ll navigate over to IP address management here if I can find it. There we go, IP addresses, manage subnets and IP addresses. And one of the things you’ll notice in IPAM is that there are organizations of subnets we’ve structured these subnets together. Usually they either represent business groups, business units, or they represent geographies. And so users of IPAM take quite a bit of time to structure their subnets into something logical and understandable. What we’d like to be able to do is leverage that same kind of organization and grouping over in NTA without having to rebuild it from scratch. So let’s see what that looks like in NTA. So we’ll go over to our NTA summary. We’ll take a look at the NTA NetFlow settings here. We’ll navigate from NetFlow settings and we’ll look at where we manage IP address groups here. Now we’ve completely redesigned this page and we’ll go ahead and dismiss that. And in this page, what you’ll see is that you’ve got a collection of IP groups that are either managed by NTA or managed by IPAM. If they’re managed by IPAM, you can’t change them in NTA, but you can reference them, import them, and use them. And then that’s pretty powerful. We’ve added a new feature here to import IPAM groups. And so you’ll see the IPAM group structure that we looked at just a moment ago. And by selecting the groups that we wanna manage, we will surface those in NTA. Now, you’ll notice that IPAM has got a hierarchical structure. So we can import individual subnets over here, or we can import a single group that encompasses all of the subnets. So you’ll notice if I click all of those, I’m gonna get five groups here. And so I can work at different levels of granularity inside of NTA.
I was gonna say, if you’re configuring those inside those groups inside of IPAM, then changing group membership will automatically be reflected in these groups as well. Right?
Exactly. So as you make changes to those in IPAM, they’ll automatically be reflected in NTA. Now, if you don’t have IPAM and you’re just creating IP address groups, we’ve also added a little bit of flexibility here in terms of how we define new groups in NTA. And so you can define those by using a range, which is a facility that we had before this, an individual address, or you can use the CIDR notation now that has been a pet peeve of mine. We’ve added that — makes life a lot easier for constructing groups in NTA alone. So let’s see what we can do with these in NTA itself. So we’re gonna navigate over here and we’re gonna start with the flow navigator. And so you’re familiar with how to use the flow navigator. First off, we’ll select a source of our flow information. So we’ll look at a particular node here and we’ll select an application that we’re interested in. So for flow alerts, we specify a particular application and then we’ll look at application volumes. So let’s take a look at just our HTTPS traffic here. Now we’ll go down and we can either specify an endpoint or an IP address group. So this is where we can start to use some of the groups that we have imported from IPAM. And so we’ll add that to our filter, we’ll submit that, and now we’ll have a filtered view of traffic for the East data center IP group that is HTTPS traffic. So if I wanna write a flow alert for that, one of the things you’ll notice now when I go to create a flow alert is that I have a specification now for the IP address group that I’ve included. And that means I can write a much more specific flow alert that pertains to that group.
Oh, I just love that because that is one of those things where, especially if you’re doing a little bit of social engineering, like you’re trying to get people to watch their own consumption of maybe non-critical business bandwidth. But the problem is then if you write a lot of really specific alerts that are tied to IPS or host or something else or interfaces you risk sort of spamming everybody. And so I guess the goal here is to reduce that, to make that specificity of alerting, to reduce the number of alerts that people can disregard.
Exactly. I can be very precise about the alert that I’m writing. So for example, if I wanna look at traffic that falls off of a particular individual host and goes to zero, I can specify an individual endpoint here and then submit that. And when I go to create my alert definition, then I can use a form of the alert where I say my traffic now is less than or equal to zero. And I can detect a condition where traffic has fallen off completely from this individual node. Very, very precise kind of an alert.
I think this is gonna be really helpful and I’m really looking forward to all of the feedback from you on THWACK about how you’re gonna use this alert capability and that between that and flow reconciliation, and then being able to really pull data from VMware switches that I think is gonna be really, really cool. So thanks for walking us through those. There were also a couple of really cool updates for NCM especially in terms of being able to, I don’t know, deploy faster.
Yes, absolutely. Let’s take a quick look at NCM. We’ll look at network configuration here and we’ll look at our firmware upgrades. So we’ve made some changes to allow you to run multiple firmware upgrade jobs in parallel. We’re not serializing those anymore and that allows you to make better use of your very precious maintenance windows and keep your environment secure and up to date with the latest set of patches.
Now, of course, anytime I hear about parallelization, I wanna make sure that I can control that. So you can actually do a hybrid, right? You can have some that are deployed all at the same time, but then maybe for core or something else where there is actually a set of dependencies for the order that they need to be pushed out, you can still do that as well.
You can still do that. You’ll need to structure those jobs though. There’s no dependency management yet, but you can structure those to do a batch in parallel and then do an additional job then that is dependent on those.
Oh, that’s awesome. Okay, so that should result in faster deployments for firmware. All right, then the last thing is actually better visualization for branch office networks.
Yeah, so this is a feature for the Viptela SD-WAN edge devices and it’s an integration with UDT to be able to visualize devices that are currently plugged in, or the history of devices that have been plugged in to that device out at the branch, because it’s not always convenient to walk to the wiring closet and see what’s plugged in.
Well, Joe, thank you so much for walking us through these feature updates that are part of this release. And I mean, this is just for networking tools. One of the things that’s interesting here is I saw to me, a much snappier interface. So it looks like you were able to pick up a lot of the performance improvements in terms of how fast things render, whether they’re updating in real time, the ease of use of a lot of the dialogues that have been updated. So that’s one area where we’re gonna love to get some feedback from all of you, because these are the tools that you probably are spending most of your time in. And just in terms of configuration and like watching the IP group configuration, it’ll be really great to get your feedback. So make sure you let us know on THWACK and Joe, where can they reach you?
They can reach me at JReves on THWACK. And so that’s probably the best way to message me directly. I would love to hear how you’re using some of these features in your operational environment.
Awesome, well thanks again for being part of this segment.
You bet.
So hopefully you’re already getting a sense for how many new features have been added as a part of this upgrade. So let’s switch from talking about networks to talk about systems, administration, and servers. And to do that, please welcome James Barnes. Systems, product manager to the stars, James Barnes. James, how are you doing?
Doing great, Patrick. Thanks for that rousing introduction.
I think you might be one of the best-known product managers for the systems management products in THWACK. And at this point you’ve owned pretty much all of the systems management products at some point or another.
That’s right. From A to Z, I’ve had everything from SAM to WPM at this point. So I’ve probably encountered just about everyone on THWACK at this point.
Well, there’ve been a lot of updates as a part of 2020.2 for the systems monitoring products. So I guess the driver behind this is really, I mean, you hear us talk about hybrid IT a lot, but that really is kind of where the world is now.
Yeah, I mean we know that IT pros need support and monitoring tools to adapt to this ever-changing hybrid IT environment that everyone’s always talking about and they need to do that without missing a beat. The latest versions of our systems management solutions hopefully it can help you do that.
All right, well, we’re gonna start with probably, obvious favorite that I might just be slightly interested in and that’s gonna be API monitoring. So this is something — we introduced this before in the last release, but this is something really different. So talk to us about that.
That’s right. We started last version with an introduction to the API polling, and now we’ve expanded that and made it better, made it easier. And part of that, a very big part of that was that we introduced some new templates based upon those API pollers, strictly aimed at the cloud-related resources. So as you may remember, we have had for a long time classic SAM templates, if you will, based on the PowerShell script components that would allow you to get at those cloud-based resources. But folks found a lot of shortcomings in those, not the least of which was the fact that your credentials were kind of stored directly in there. It was hard to kind of manage that. It wasn’t very scalable, maybe not so secure. So we made it better with these API-based templates. And you can see that now in this new release.
Yeah, I think these started as a way of regaining visibility sort of down to the mailbox level for Office 365, where somebody had, migrated off an on-prem Exchange environment, for example. So I guess these were started in THWACK and then they were curated by SolarWinds and then now they’ve actually been productionized. And one of the things that you mentioned there is that you’re saying that the credentials are now part of the encrypted credential store like any other resource, right?
Exactly, as anytime you’re building one of these API-based pollers, you can put the credentials there. They’re stored appropriately versus the old method of having them just kind of sitting in the script component itself.
Okay, well, let’s start with how about a map? I think that’d be a great way to visualize this. So walk us through what a typical application is where it’s a composite combining a bunch of different monitoring techniques.
Sure, so yeah. Let’s take a look at this image we have here is a lovely image kind of built around that lovely Orion map stuff that we’re talking so much about these days. But what you can see from this is that it’s clearly centered on Azure in the middle here and then you’ve kind of got the highways running north and south, east and west. If you follow any of those to their logical conclusion, you can see that this is truly hybrid. This is on-prem stuff, connected to cloud stuff. The Azure AD is really focused heavily in that. If you look closely at some of the parts of this map, you’ll see there’s API pollers reflected, standard polling. So it’s just a great way to take all of this new goodness in SAM and tie it together with one of the platform-level things in Orion maps.
What I really love about this too, is it really does make those first-class citizens in terms of data. So in this case right here, you’ve got processes that are running in Azure that may be monitored through any number of different APIs. Azure itself on-prem and then the connectivity to it, but it looks like right on the right-hand side there, when you created this map, you just drag them over out of the catalog of available metrics, but then they’re just being provided by these API templates. Does that also work in PerfStack and AppStack?
Yeah, absolutely. These relationships are the basis of everything now. So you don’t have to go create those manually or dream them up there. They’re just kind of there to, as you said, kind of in the toolbox, just grab them and drag them.
Okay, and the readme file for SAM is gonna actually go through step by step, how to use those templates.
There’s always documentation if you want it, Patrick.
Okay, good. Well, ’cause we just don’t have time to show it because there’s so much else that we’ve got in this episode. All right, so next step you’re really excited about this and I am, because it really is the beginning of hyperconverged visualization. And so that’s gonna be mapping for Nutanix.
That’s right. We aim to do a better job of supporting mixed environments. And of course, Nutanix is big in that arena. When you’ve got not only hyperconverged, certainly a buzzword we could harp on there but Nutanix is the first time where you start to see things kind of stacked on top of one another. Nutanix can host Hyper-V, it can host VMware. So we obviously-
Platform as a service.
That’s right. And so we needed to, anybody who was with us for the previous release or has been with us for a while, knows that we already had the Nutanix support in there, but only at the tech preview level. And this now coming over here in 2020.2, we’ve gotten away from that tech preview mantle. This is fully supported. It’s no longer tech preview realm. And to kind of round that out, some of the things that we’ve added are things like storage views at the cluster and host and VM level didn’t have those before. Now we’ve got CPU and memory and network usage at the cluster and VMware level. So a far more expanded view of what’s going on inside the Nutanix environment and of course, as you already alluded to, that means that it’s all gonna look very, very nice in a map. So maybe let’s take a look at an example here.
I think you’ve got your Nutanix logo right there at the center, of course, with the copyright mark, but that’s not just to indicate that this is a map. I mean, it’s to visualize it, in this example, but this isn’t just some just monitoring that we’re doing. This is actually because we’re a technology partner with Nutanix. This is on their website.
That’s right. There’s a relationship there and we’re proud to be part of that.
Awesome, so talk to us about what you got here. Well, it’s just a very simple representation of a Nutanix environment from everything from the clusters to the storage containers, the CVM is reflected there, just really anything that you would expect to find in your Nutanix environment is right there at your fingertips. Again, a lot of it’s gonna be built for you, but anything that you think you might want to add, Orion maps gives us that ability, just reach in the tool tray and add the things that you need to add.
Right, so just like anything else it’s part of AppStack or PerfStack, or one of the common other metrics or relationships, you may have things that are part of your application might be down to the OS level or a traffic level or something else, or you wanna have a performance for a service, that’s not something that Nutanix is aware of, but it’s something that the Orion Platform is aware of. So it allows you to combine those together and create that view of all the components of an application even if some of them are essentially in your PaaS platform or in traditional infrastructure or even out in the cloud.
That’s right. Yeah, you can kind of think of yourself as an artist and you’ve got a palette of colors and Orion is providing that palette of color. So it doesn’t have to be coming directly from Nutanix. I could add environments that are related to it, but not necessarily directly. Like you said, Nutanix may not be aware of the things that are running on top of it, but you can certainly make the map reflect that reality.
Awesome. Okay, next up would be storage. This’d be Storage Resource Monitor. More controllers, right?
That’s right. We always try to, with each release, we strive to expand that portfolio of controllers that we not only support outright, but obviously there are times when we wanna add a little more depth to that support. Maybe last time we didn’t quite get to the level that the customers were looking for. So we continued that story. NetApp in seven mode, you now have hardware health there. And with VNX CLARiiON, people were looking for a little more information, extended information about the controllers. So we’ve got that as available as well. And actually real quick here, let me just pull up a couple of images and we’ll look at what that looks like. So here is that extended controller support. And here we have a NetApp in seven mode that is reflecting hardware health, everything green.
Yep, there’s all the details in it. And this is one of those things where every time we do a major release, it feels like we add a couple of more. And so at this point, in terms of controllers and arrays, there are now dozens, right?
Yeah, that’s right. The list is very long and very comprehensive. Of course, we seek to increase that every time, but it’s hard to find an array we don’t support now.
Yeah I think if you’re a storage manager and you hear people talk about hybrid IT. You’re like storage has been hybrid for as long as they can remember. Okay, so the next one, another number one feature request has been upvoted for a really long time and that is flat file monitoring for Windows Servers.
That’s right, Log Analyzer. We decided to add a new log source for you. So anyone who’s been along for the ride knows we already had syslog and traps. And in previous recent releases, we added native support for Windows events and of course, native support for VMware events. But this new log source, which is flat log files on Windows hosts was very highly requested from customers. And basically what that means is you’re gonna be able to utilize the agent, the standard Orion agent that you’re probably already using on a lot of those nodes anyway. This is just a plugin on top of that and so it’s going to go and get those flat log files, whether they’re Apache or mySQL, or maybe, hey, even Orion running on your Windows machine.
Or a custom application, that’s spitting out some log.
That’s right. Anything you could dream up, that’s running on that host, that’s spitting out a log app or an application log is gonna certainly be valid for this. And it’s the other part of it is we strove to make this easy. So basically in the Log Analyzer settings, there’s a place now where you go and you build a profile and it’s simply a matter of giving me the path to the log files. Give me a wild card, if there’s numerous log files there that you wanna collect. And we basically do the rest of the work for you. You don’t have to traditionally doing this work would have required a PowerShell script or a Perl script on the SAM component monitor side. This makes it easier because you don’t have to understand scripting and it also makes it more real time. SAM is still gonna be based on a polling interval and not that that’s bad, but oftentimes with log events, you wanna be really… [Snaps fingers] More real time.
It’s gonna be based on the amount of log data that’s available. If there’s nothing coming out in the log, it’s not gonna take up any time. I think what I really like about your point there is, I mean, I love to script, but this is gonna make it a lot easier ’cause then you don’t have a script that’s PowerShell or Perl or who knows what else. And then the other thing is because it’s using the agent framework, it’ll also support client push as well. So if you have someone who maybe, I don’t know, is remote, who normally would be on-prem, where you can’t poll that agent, you can actually do client initiated to push that agent data out as well.
Yeah, that’s right. It’s anything that the Orion agent could already do is gonna follow suit here. There’s no twists or turns. It’s the basic agent that you’re used to, just now it can do log file ingestion for Log Analyzer.
All right, so last step. This one is a favorite. It’s been requested a lot and that is you’ve extended the recorder that’s used for WPM, Web Performance Monitor, so that it can also save those recordings for playback on Pingdom.
That’s right. Many people have been telling us since we bought Pingdom, which has been many years now that they’d love to see these two products come closer together. And so we’re starting to take that path. We’re going down that path, and this is step one basically go into the recorder, create your recording, create your transaction. And when you’re done, you have now a fork in the road that you can take. You can still save it to Orion, of course, but now you could also save it to Pingdom and run that transaction directly from Pingdom. So you can take advantage of the Pingdom infrastructure to run those or you can save it to your traditional Orion infrastructure.
You have a screen we could look at?
I absolutely do. So here, you can see the recorder interface kinda glance to the upper right. You’re gonna see there that now truly enough, there is a option to save to Pingdom and here I’m saving my recording to Pingdom and here it is listed in a inventory of transactions running on Pingdom itself.
So that’s the Pingdom interface, not the Orion interface.
That’s right. That’s the big thing here is, this is your we’ve drilled all the way into the detail now and this is our transaction that we recorded in the recorder running directly on Pingdom.
And the thing I love about that too, is that you’ve got the option in that save dialogue, either save it local. So maybe if you have change control or something else you wanna just have backups of it. You can save it directly into the Orion Platform for WPM, or if you wanted to, you could even poll one, that you’re running internally, maybe, load it up inside the editor, and then push it to Pingdom as well. So you can move them between those two environments.
Yeah, that’s right. The recorder is able to act as the pivot point there. So you can pull something, open the recorder, open something from Orion, edit it, do whatever you’re gonna do with it, and then decide, do I wanna save this back to Orion or do I wanna now move this out to my Pingdom account?
All right well, James, thank you so much for taking time to be with us today and to go over all of these updates across the systems and monitoring products.
No problem. It’s my pleasure and of course, if anyone has any other comments, questions, concerns, or otherwise, you know where to find me on THWACK.
I think everybody knows where to find you on THWACK at this point, James. Okay, next up, we’re gonna talk about updates to the database performance monitoring products. Joining us now, please welcome John Maxwell, senior product marketing manager for SolarWinds database products.
Hey Patrick, thanks. I’m really excited to be here because this release is something that both the product team and our customers have been waiting for for a long time. The DPA 2020.2 release, we’re really highlighting our new Postgres support. Postgres support is very important for a couple of reasons. One for really the past year and a half it’s been the number one most requested feature on THWACK. So we’re really excited to add the support into DPA since so many of our customers, they’re adding open-source databases like Postgres support can now have that support in DPA. Separate from this being a major ask from the customer base, a lot of people don’t realize that Postgres now, according to the website DBengines.com is actually the fourth most popular database out there. And we’re certainly seeing both new customers and even existing customers who have large Oracle and SQL Server implementations, they’re adding Postgres to the mix. So we’re really excited about this release.
I think the thing that I was gonna say, I think the thing that I’m most excited about it is actually sort of a little bit more of the enterprise side is that you’re also supporting the enterprise extensions or the Oracle extensions for Postgres for users who transitioned to Postgres from Oracle and then are trying to kind of catch up to the manageability that they previously had with the direct Oracle support.
Well, and let’s cover the databases or the instances of Postgres we support. So if you look at the slide that’s now up on the screen, you’ll notice that we went full-blown support for Postgres. So we have the, of course, native Postgres support you get from PostgreSQL.org. So that’s the open-source version. We also support enterprise DB Postgres, and that is the version of Postgres that has a Oracle compatibility mode. And that is for customers that might be transitioning applications to Postgres. So we support the native open-source, we support the enterprise DB Postgres with that Oracle compatibility. And there’s three more platforms for Postgres we support. We support two of the popular Amazon implementations of Postgres. One is RDS for Postgres and the second is Amazon Aurora Postgres. So two of the big name, popular implementations at Amazon. And of course last but not least, DPA already has broad Azure support. So we’ve added Azure database for Postgres support in Azure also. I wanna mention for the on-prem versions, we do support Postgres running in both a Linux and Windows server. I’ve already started to get that questions a lot about what servers are you supporting? We support Linux and Windows.
Well, that’s the thing that I really love about this is that y’all didn’t start with just a couple of features and then build out. I think a lot of the conversation that we were seeing on THWACK and the user community, and certainly when we’re out talking at SWUGs and other events is that Postgres tends to be used in a lot of different ways, and teams, our customers are constantly evolving how they’re using it. And so to say it was limited to a certain subset was gonna be part of the problem, because one of the great things about Postgres is you can use it in so many different ways. And so that really drove the decision to release all of these features with the introduction of this support.
Now we certainly, in addition to the broad support of Postgres platforms, we didn’t skimp when it comes to functionality. And what I’d like to do now, let me switch to the demo so I can go through the core functionality that users may be used to when it comes to Oracle or SQL Server Postgres. And then I’ll go into some of the new functionality that’s specific to Postgres. All right, let’s walk through the product. I wanna highlight really three specific areas. Some of the new options that have changed have to do with Postgres and other databases, then I’ll compare the existing features that we have that support Postgres along with some of the new features. So let’s go up here to the options tab. And you’ll notice that we have the register a key and you can go in and see that we’ve added Postgres, like I mentioned before, we have the native Postgres support along with the EDB Postgres. We have the options for Amazon, both RDS and Aurora, and of course the Azure database for Postgres. So in addition to having Postgres show up now under the register section, notice down here under administration, we have a new option called trusted certificate management. Now, this is applicable to all databases. So all the databases now that DPA monitors will have certificates in the Java trust store. But one of the things that we’ve added, specifically for Postgres is the ability to import our certificate into what’s called the DPA trust store. And you also have, as you can see from the DB certificates tab, you have the ability to go in and specify a certificate for a specific database instance. So those are two new options that you’ll see when you go to the options tab. But I also wanna point out something. This is not really applicable, or it wasn’t added just for Postgres, but it’s a feature again that customers have been wanting. And that’s when you go into manage alerts, you go into create an alert, you’re gonna see a new option. And what I’ve got down here is notice, we now have something called normal. And again, something pie in the list of THWACK users, this gives you the ability to do a notification, either to yourself or to a group of people, or more importantly, to some automation tool to basically say the alert that we hit is now gone back with the normal ranges. So basically, the problem no longer exists. I just wanted to call that out.
You’ve automatically resolve an issue.
Absolutely. So three kind of, housekeeping type issues I wanna talk about. Now, let’s go in and then select a Postgres database. Now, one of the things, this is one of our labs. If you hover on this and you get a message, an error message, you do have to, and this is in the admin guide. You have to do set some PG stats information on. So for example, this one, you have to enable PG stats statements for us to collect certain levels of information. So if you hover on this and you see like a little weird error message, just go to the admin guide and we’ll note the things that you have to turn on for Postgres. So a little different from some of the other databases we support. But what I love about this again, in addition to that broad support is it looks very familiar. And it’s just as if you’re going to Oracle and SQL Server into mySQL. So we have the machine learning anomaly detection. We have the ability to look at the worst performing statements. Notice when I go up here into tuning, now I have my query advisors. So I can see I can get advice on the worst performing queries. You can see on this one, we have some times of the day where we have very high execution times. We also have our most significant wait is around memory and CPU, and we can call out and delve down into those times. We have all the statistics, including blocking various transaction rates, RO information. We have added some information that’ll go into the later about, things like the wall file and evictions and things like that. So again, we’ve incorporated some of the new Postgres stats into this. And then of course, then you’ll notice here, if I select on current running transactions, I can go down here select a specific time. I can go in, go down to a specific query and notice I have the ability to look at live plans and then I can go ahead and run that live plan to see what it would look like. Again, very familiar with what we do with a lot of the other databases. So you can see now I have the generated plan from Postgres.
Well, it’s really helpful for me is that, we talk about, being an accidental DBA. For me, I’m an accidental, adjacent DBA. I’m, I’m pretty feeling confident with SQL Server, but as I move into different database platforms, that assumption that people will make, oh, well, then you must be able to understand, but they’re so diff, a lot of times those databases are really different. And in this case, you’re basically normalizing the sort of base functions of Database Performance Analyzer. So for example, the ML/AI-based alerting for anomaly detection has been extended to include Postgres. But as you’re showing before, you were getting also those Postgres-specific data types, or in this case, the way that the execution plan works incorporated into those same views.
And Patrick that’s our goal is to really have that single pane of glass experience no matter what database you have. Because what I found, just talking with dozens of customers, our typical customer has three or more databases. So we wanna provide a consistent approach to pinpointing problems as quickly as possible. Now, the other thing that I do wanna show that we brought over for Postgres before I go into some of the new features is virtualization. We do support Postgres running in a VMware virtual machine. And the reason I bring this up is I did a THWACK survey recently, and Postgres was one of the top five most virtualized databases. So we do know that people are running Postgres in a VM, and this is one of our most popular virtualization views, because you’re looking at your top SQL. You look at the what’s going on from the instance perspective, the virtual machine, down to the physical host and the storage. So this gives you a great time slice of what’s going on for that Postgres instance running in a virtual machine. And noticed just as we have before, you can look at the current or running queries But this feature is really handy for DBAs, because it allows them to see exactly how their virtual machine is configured. I got two virtual CPUs, how much memory you have, but also, what host am I running on. What’s the physical server and even, what other VMs are running on that host machine. And of course, least but not last are the resources tab. Now this is from a VM perspective and I’m gonna cover some of the new features we have for Postgres, but notice here that I’ve got CPU. Now, one of the little gotchas we found with Postgres, Postgres is not as rich of a database when it comes to say an Oracle or SQL Server as far as the data we can collect from it. So Postgres actually does not have a feature to collect CPU utilization, but here we’re able to collect it from vSphere and give you the CPU utilization of Postgres in that virtual machine. But before I get into the rest of the metrics here, let me go back over into the normal view. All right, so we covered basically all the new functionality from a setup perspective. We covered the functionality we brought over that we support in other databases to show you the rich metrics that we’re collecting that are generic to Postgres and other databases. But what I wanted to do now was go specifically into some of the new metrics that we added just for Postgres. So I’ll click over here on the resources tab and notice we have the usual suspects, like memory, disk, sessions, waits. But notice three new tabs here around vacuum, checkpoints, and cache eviction. So vacuum is a very important back-end process in Postgres that deals with dead tupules or rows that are deleted or modified in Postgres. Vacuum goes in and removes obsolete rows. So you wanna make sure that all those modified or deleted rows are getting removed and that’s why modifying vacuum is a very important, if not one of the most important back-end processes to look at. Another very important Postgres metric are checkpoints. So with Postgres it temporarily stores blocks in shared buffers, and then it writes those to a wall file. Write a head log that even remember, I covered that when we were looking at a specific query. This of course reduces the number of writes to disk, but you wanna monitor this because it’s important that this back-end activity if it’s impacted, you might hit the threshold on your write-ahead log size or something like that. So again, a very important metric to monitor, and last but not least is cache eviction. With Postgres, shared buffer cache store is used for change information before it’s written to disk for obvious reasons for performance and these cache eviction, basically there’s three back-end ways that the blocks are finally written to disk. And then that’s the checkpointer process, the writer process, and the back-end process. So again cache eviction, checkpoints, and vacuum are three very important new features that we added to Postgres. Also, I don’t have time, but we have all kinds of new Postgres reports. So when you go into reports, click on one of your Postgres databases, you’ll have a mini reporting options up there.
And John, I had a question there for ya. One of the things that I think you mentioned before that a lot of users are actually running Postgres in VMs are the vacuum and checkpoint processes and monitoring and alerting those tend to expose resource contention issues where there’s a bottleneck that’s actually preventing that rewrite activity?
Yeah, actually that’s a good question because if you are underserved for example, in disk storage, your wall files can fill up, or if you haven’t allocated enough virtual memory, you may fill up with dirty buffer. So having that VM information is really of paramount importance, running Postgres in a VM.
So a typical troubleshooting workflow would be, let’s say you have an issue, an alert that’s coming out of a cache clearing. You’re gonna then go, let’s say if it’s virtualized to the virtualization tab and then scroll down to storage, and that’s where you’d typically expect to see that.
Absolutely.
Okay.
And again, the whole goal is having that single pane of glass, where we’re putting the Postgres information, the system information, the virtual machine information all there for you to see with one view. And you can see on this summary slide, we have two places for you to go. We have the generic DPA product page, but we’ve also got a very detailed use case page written for DPA that covers really everything I’ve talked about in detail with the new Postgres supporting, including all the types of Postgres we support, some screenshots, and the like.
This has been fantastic and thanks for going over this. I’ve talked about Database Performance Analyzer a lot over the years. I’ve actually learned a lot about new databases and things that are maybe outside my specialization, or at least outside my experience because of the way that it combines metrics and names, so that it almost is a Rosetta stone for me, about the way that one database approaches let’s say cache clearing or rights, or the way that it’s doing block reads or something else. To another, and it lets me sort of extend what I know about SQL Server and mySQL to other database types. This has been fantastic, John. Thank you so much for walking us through this.
My pleasure.
And with that, we’re gonna switch to security. So we’re gonna go over to Manja and Ashley to talk about some of the new updates in the 2020.2 release for our security products.
Hello, everybody and welcome to the SolarWinds security corner. We’re very happy to have you. My name is Ashley Adams. I’m in Austin, Texas, and a product marketing manager. Today with me, I have Manja. She’s in our Berlin office, and she’s going to cover along with me some of the latest greatest features from SCM, ARM, and SEM. These are gonna help you to better manage, detect any potential threats, and up-level your security posture. So with that, I will give it over to Manja.
So, hey, everybody from Berlin, and actually today’s a great day talking about all the news and let’s get started with Server Configuration Monitor and with SCM, as we like to call it internally, we enhance the capabilities to monitor through databases for changes to table and index structures, for users, permissions, and resource configurations for SQL Server, Postgres, and mySQL Server. So let me take you into the demo for a second. Looking at the demo right now, you see a list of your server configuration nodes. So you see all your servers, and then you can drill down into the number of profiles you have assigned to them. You also see a baseline number of mismatches, and of course, we allow you to drill down into a detailed configuration page. And by going there, you can choose a profile with a baseline mismatch. So right now, from here, you can click into one of those and what you’re gonna see is a before and an after situation. So we allow you to see your situation before you had any configurations happening, and then your after situation, and obviously there’s a mismatch and this is gonna help you to mitigate any things happening in your servers, set up changes. So from here, you can take over and just edit your changes, save that, and go back to a more configured situation. So with that, taking it over to ARM, which as I said before, is focusing on hybrid IT as the number one feature. And there has been some more tiny teeny features that we added, but overall, we increased the number of resources you can now monitor and manage. And with that, we increased the security capabilities for Microsoft Teams to manage and secure access. We also gave you the ability for Azure monitoring to do like a more in-depth monitoring of what is happening in Azure AD. So with that, you’re protecting your in between, like your on-prem, but also your cloud and everything that sits in between those two worlds, you can now monitor and report on. And on top of that, we increased the interoperability with SEM and ARM. So ARM is not only taking all those events and alerts, but it’s getting more information into Security Event Manager based on user. So you will not only see just logon failures and anything happening in your system from SEM, but now you get additional information on a certain user and where they would have permissions. And also if they act against those permissions, SEM can now capture that as well. All this is done by syslog, so it’s as easy as it can be. And with that I’m gonna take you over to the ARM demo for a second. As we look into ARM the rich tie-in and we see the most important features of ARM listed on the start page, starting with permission analysis, really the first step that everybody should be doing, like who has access to what, the user provisioning and you can do that for multiple resources and technologies. Also the security monitoring with all your alerts that you can now forward to SEM. And then the biggest part, or it seems like the biggest part is the documentation and reporting. And this is exactly where I wanna take you right now, because with all these latest features, what is great about it is that you can now report on Teams and Azure AD. And taking you into here, this is just one of the reports you can do. You can add your own titles, you can have more information added to this, and this is where you’re gonna choose your resource. And you can do that of course, for like File server, Exchange, SharePoint Online, SharePoint, but now you can also do that for Azure AD and in addition for Teams. And this is where we’re gonna take you right now. So we drill down into Teams and this is just a demo setup. So in your environment, this is all gonna look like different. You’re gonna see all your groups and your team members, but I’m gonna go for all colleagues. And this is as easy as it gets. You just choose the certain area you wanna report on, you can then add more details, filters, group settings, or any other options. And there is a great feature hidden in this. You can not just only start this manually, but you can also set this up to be sent to you on a daily, weekly, monthly, or whenever you want kind of basis. So this is gonna send, or been sent to you as email, and once we apply this, this is gonna take a little second and we hit the start button and I’ve prepared a report for you to look at. And right now you see this is gonna come to you in a PDF kind of format. So you see, this is our ARM report, who has access where, and we are looking at all colleagues, and we are also looking at Teams and Azure AD. So now it’s breaking down for us the all colleagues section in our Teams environment, and you’re gonna see all users that are under all colleagues. Obviously that’s gonna be all colleagues. But what’s great about it is showing you if these are just a member or if they are an owner of a certain group. And this is important because right now with everybody working from home, not being in the office, we don’t know who can add people to a team or get people out of a team. And with this, we just gain more overview and as always in ARM, you get a little explanation to everything, so even if you don’t know what all this means, this is gonna explain to you in the report in more detail, or you can do way more things with ARM in particular and you can afford everything and you can report on everything. You can have things sent to you as an email but if you wanna learn more about it, just let us know. But with this, I’m kicking back to Ashley for Security Event Manager.
Thank you so much Manja. Those are some really interesting features. And today I’m now going to be showing you guys the new feature in Security Event Manager. We have a couple of different highly requested user features, but what was really big for us was the analyze historical data. So if you toggle over to the events tab, you see your events coming in real time as usual. But if you wanna take a look a little bit more in depth, you can click over to that tab and you will then start seeing events in this histogram where you can look at events during any specific periods. So if you click here, you can look at events over the last 10 minutes, 30 minutes, 30 days, or of course, be able to customize that date range to your specifics. By clicking search, let’s look at events for the last 30 minutes. A user case that people are often interested in, of course, is seeing user logon failures. So what we have, what’s great with SEM as you probably already know, is our amazing ability to have a bunch of predefined filters. So if you type in something like logons, you can look at user logons, simply add that, goes right up into your query search bar. Just wanna hit search again. And now you’re specifically looking at those events over a given period of time. What’s great about this as well, is that you can actually drag and drop to zero in, even on a more specific time base. And if you, of course, wanna look at sort of the normalized log and an event or a specific user, you can click into that event and you will have all of your event details displayed on the right-hand side of your screen. All right, guys, thank you so much for watching. Just remember this is the 2020.2 release. So make sure you’re upgraded to the latest version it’s available to you now.
And also make sure you’re gonna leave some feedback on THWACK for us on how you like it, and also what you’re gonna see in the future. And thank you so much for being with us and see you soon.
See you next time.
Thanks again for being a part of today’s episode. We loved having you with us and like we warned you at the beginning, this was a mega episode. I think this might have been one of the largest ones that we’ve ever done, but there were so many features that were released as a part of this latest Orion Platform update but it took a while to get through them all. And we didn’t even have time to do deep dive how-tos on all of them. So make sure you check out the link that accompanies this video for details to a THWACK article, that’ll actually link you to the individual features and walk you through them. The other thing of course is hopefully, you’re already a part of the THWACK user community. There’s 150,000 professionals who are part of the THWACK community and they are doing and have been doing advanced things with the Orion Platform for years. They are always eager to help you get started and to walk through some of the things that they’re doing in their environment. One other thing of course is that we’re gonna be online here for a little while, taking your questions. And if you see the chat box, well then pop your questions in and we’d love to hear from you right now. Now, of course, if you don’t see the live chat it’s ’cause you’re not with us live. And the way to fix that is to come by our homepage and that’s lab.solarwinds.com. You can see features, you can see past episodes, and most of all, you can see the schedule for upcoming events to make sure you can be with us live next time. Thank you again so much for being here and we’ll see you again soon.