Traditional systems monitoring solutions poll various counters (typically simple network management protocol [SNMP]), pull in data and react to it. If an issue requiring attention is found, an event is triggered—perhaps an email to an administrator or the firing of an alert. The admin subsequently responds as needed.
This centralized pull approach is resource-intensive. Due to the pull nature of the requests, it results in data gaps and data that may not be granular enough. Moving to a telemetry-based monitoring solution allows you to have richer intelligent monitoring solutions that are better at anomaly detection. This is a big benefit of a modern approach to monitoring.
Another reason for the necessity of modern monitoring is the number of systems depending on accurate monitoring to trigger scale-out or scale-in (i.e., remove nodes) automated infrastructure operations. If your monitoring fails or isn’t accurate, you could potentially experience outages if your application doesn’t scale as expected.
Comparing Streaming to Polling
Streaming telemetry can be complex, but its design allows for better scale. A good example of this is the public cloud providers Amazon, Microsoft, and Google. They each have millions of hosts and endpoints needing to be monitored, which means a key part of their software development is building a telemetry and monitoring pipeline without single points of failure to provide the level of intelligence and automation required to run their data centers at operating scale. You can take the lessons the hyperscale providers have learned and incorporate them into your own monitoring solutions.
As mentioned earlier, monitoring solutions that rely on polling can have trouble scaling. Increasing the polling interval for a given performance counter increases the load on the system you’re monitoring. While some counters are lightweight and can be hit quite frequently, other counters aren’t as agile, resulting in significant overhead.
Since streaming data is constant, it may seem to have higher overhead than a polling solution, but this isn’t the case—enhancements in technology have enabled lightweight solutions. In many cases, your data will flow through a streaming query engine like Kafka, which will allow for alerting on outlier values, while archiving all the values to support trending the data and machine learning over your data.
This architecture is known as a lambda architecture (
Figure 1). It’s used broadly across applications beyond monitoring, like many Internet of Things (IoT) devices and sensors. It enables lightweight alerting for out-of-band values in real-time while allowing for low-cost storage of recorded data, which supports deeper insight into a cold data store.
Having all this cold data gives you the ability to perform analytics across those streamed data values.
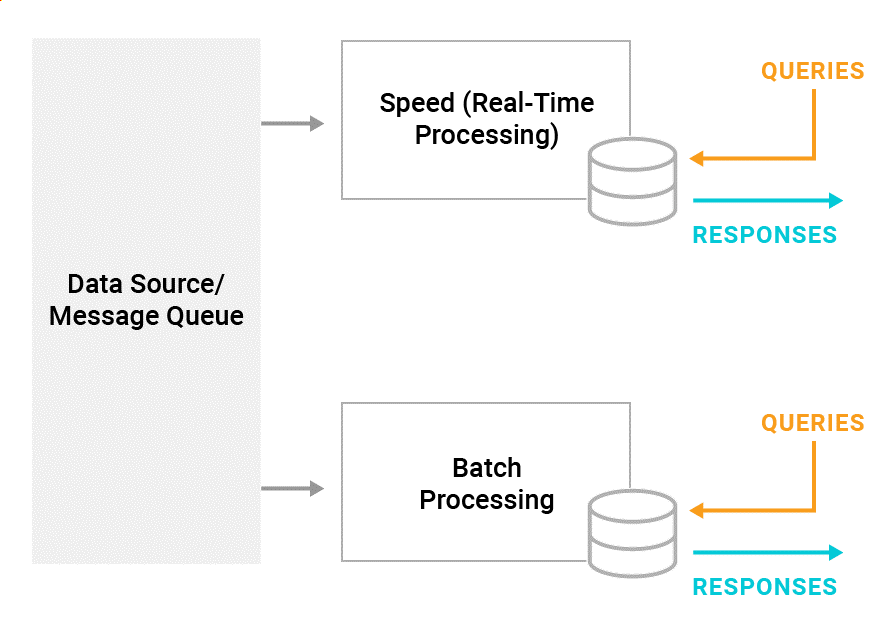
Figure 1: A typical lambda architecture
Ensuring Data Quality in Your Monitoring
Most monitoring tools allow you to customize your alerting ranges. You may want some systems to alert you when CPU usage is over 80%, while other systems may typically run at high CPU as part of their normal operations.
This dichotomy can be tricky. You don’t want your alerts to overwhelm administrators, but at the same time, you don’t want to set your thresholds such that everything in your monitoring system looks OK while your data center is on fire. You should look to use smart, or dynamic, monitoring, which captures a baseline for each system and only triggers alerts when the value is out of band for both the specific server and time frame.
By collecting a larger volume of data, many monitoring tools are building machine learning systems that perform deep analysis on data. This processing allows for smarter workload-based alerts, and it can use machine learning to provide more intelligent alerting.
(As always, it’s important to confirm these smart alerts are working correctly and providing alerts as expected.)
Keeping Your Monitoring Online
As part of building smarter monitoring for your organization, a question you need ask is, “How do we detect problems or outages in our monitoring systems?” As you move into more dependence on automation connected to your systems, monitoring this becomes a bigger issue.
There are a few approaches you can take to protect your monitoring system. Start with building redundancy into your infrastructure, whether it’s virtual machines or deploying Platform-as-a-Service (PaaS) offerings to different data centers or cloud regions.
Another option is to have either a custom or secondary alerting mechanism to check the status of your primary monitoring system and act as a failsafe. Another option is to have a canary alerting process you expect to fire an alert at a regular interval and have a process that launches an escalated alert if the canary process doesn’t fire.
Beyond these approaches, you should ensure your
alerting mechanism tests all the layers of your application and not just a single layer. For example, you should test the web layer, the caching layer, and the database, and alert you if any one of those fail.
Interested in finding a solution built to help you achieve your customer experience goals while ensuring service availability? See how
SolarWinds® Hybrid Cloud Observability can help increase visibility, intelligence, and productivity across your on-premises, hybrid, and cloud environments.